How to Add Bollinger Bandwidth on MT4 Charts - Adding MT4 Bollinger Bandwidth Indicator
Step 1: Open Navigator Window on Forex Trading Platform
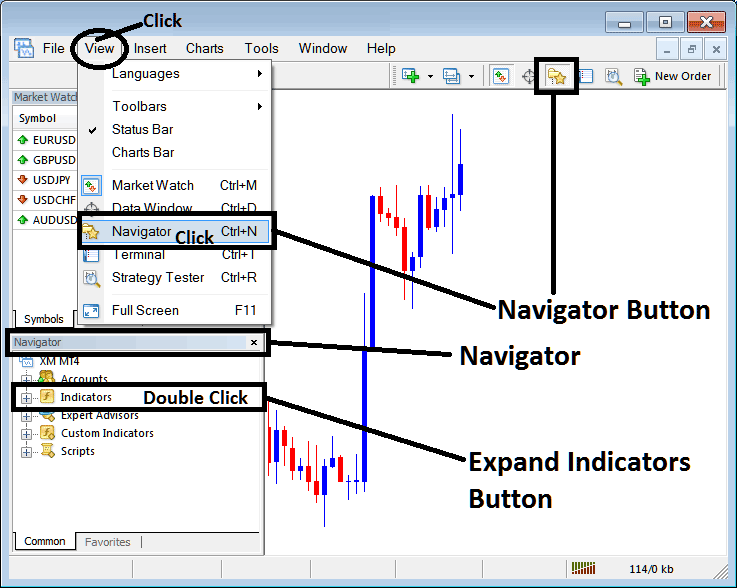
Open Navigator window as shown & illustrated below: Go to 'View' menu (click on it), then select 'Navigator' window (click), or From Standard Tool Bar click the 'Navigator' button or press keyboard short cut keys 'Ctrl+N'
On Navigator window, choose 'Indicators', (Double-Click)
How to Add Bollinger Bandwidth Indicator on MetaTrader 4 - MT4 Bollinger Bandwidth Indicator
Step 2: Expand the Indicators Menu on the Navigator - Adding Bollinger Bandwidth MT4 Indicator
Expand the menu by clicking the expand button marker (+) or double click the 'indicators' menu, after this the button will appear as (-) and will now display a list as shown below - select the Bollinger Bandwidth forex chart indicator from this list of forex indicators so as to add the Bollinger Bandwidth indicator on the forex chart.
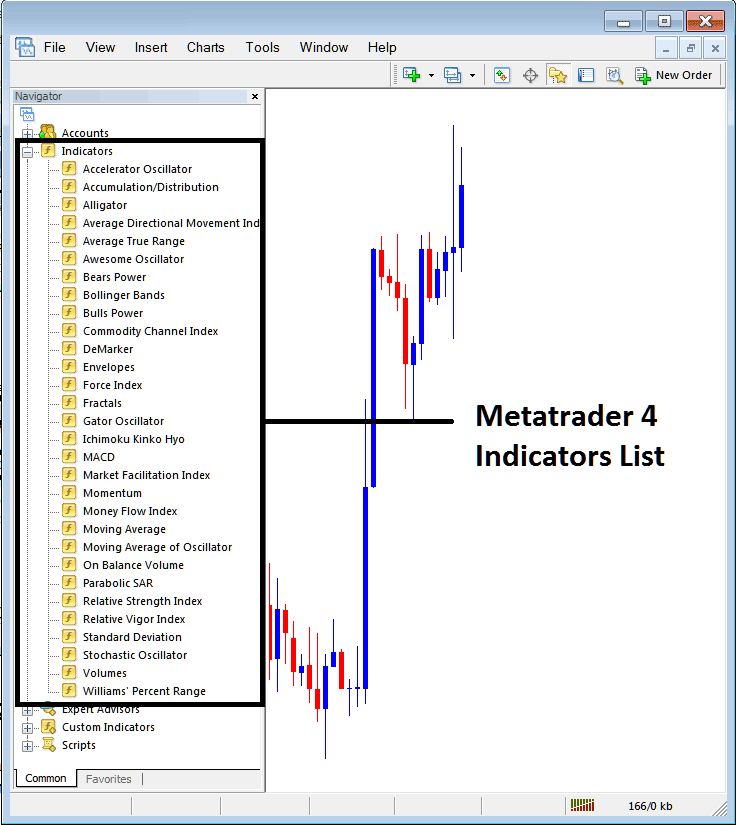
How to Add Bollinger Bandwidth Indicator - From the Above window you can then place Bollinger Bandwidth indicator that you want on the Forex chart
How to Add Custom Bollinger Bandwidth Indicator to MT4
If the technical indicator you want to add is a custom indicator - for example if the Bollinger Bandwidth technical indicator you want to add is a custom indicator you will need to first add this custom Bollinger Bandwidth indicator on the MT4 platform & then compile custom Bollinger Bandwidth indicator so that the newly added Bollinger Bandwidth custom indicator pops up on the list of custom indicators in MetaTrader 4 software.
To learn how to install Bollinger Bandwidth indicators on MT4, how to add Bollinger Bandwidth indicator window to MT4 and how to add Bollinger Bandwidth custom indicator in MT4 - How to add a custom Bollinger Bandwidth indicator in MetaTrader 4.
About Bollinger Bandwidth Technical Indicator Explained
Bollinger Bandwidth Technical Analysis and Bollinger Band width Signals
Developed by John Bollinger.
This technical indicator is derived from the original Bollinger technical indicator.
Bandwidth is a measure of the width of the Bollinger Bands
Calculation
Bandwidth = Upper Band - Lower Band
Middle Band
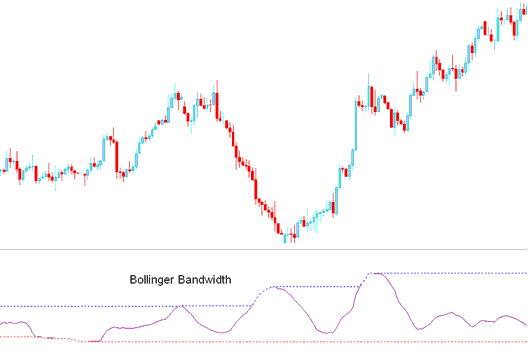
This is an oscillator, based on the theory that price and volatility occurs in cycles.
Periods of high volatility is followed by periods of low volatility.
When volatility is high, bands are far apart, the bandwidth will also be wide apart.
When volatility is low, Bands are narrow and the bandwidth indicator will also not be narrow.
The blue line represents the highest Bandwidth value for a previous number of periods.
This line also identifies periods of high volatility
The redline represents the lowest Bandwidth value for a previous number of periods.
This line also identifies periods of low volatility
Forex Technical Analysis & How to Generate Signals
Consolidation - Bollinger Squeeze
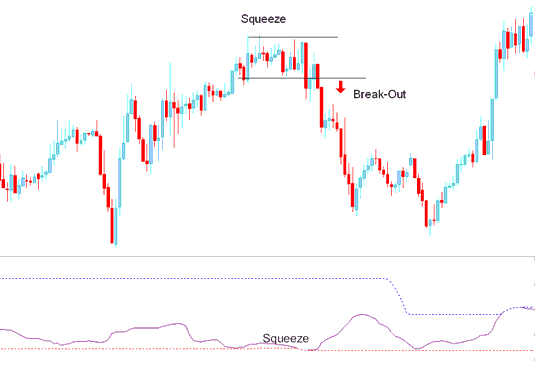
Bollinger Bandwidth is used to identify the squeeze, which is a consolidation period of price, after which the price then breaks out in a particular direction.
Signals are generated when there is a forex price breakout signal is generated by the indicator starting to go up after touching the red-line. When the bandwidth line starts to move up it signifies that volatility is rising as the price is breaking out.
Squeeze
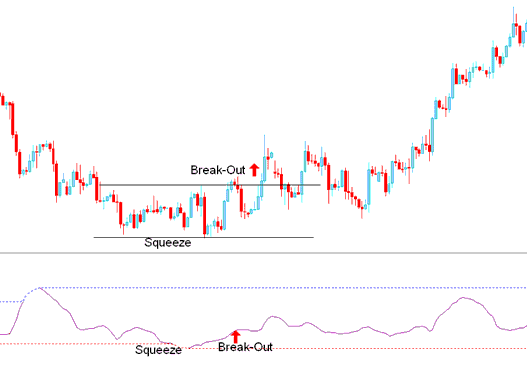
Breakout Signal After Bandwidth Squeeze
However, this is a directionless indicator and needs to be combined with another indicator such as the moving average to figure out the direction of the trend/ Break out.


