What is Rainbow Charts Indicator Forex Buy Signal and Sell Signal?
Rainbow FX Charts Forex Indicator Buy Trading Signal
How to Generate Forex Buy Signal Using Rainbow Charts Indicator
Steps on how to generate forex buy signals using Rainbow Charts indicator:
This Rainbow Charts indicator buy signal tutorial explains how to generate forex buy signals using the Rainbow Charts indicator as shown below:
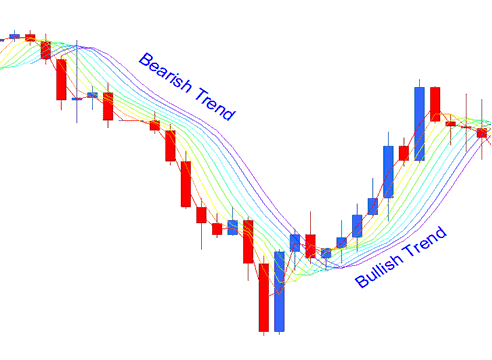
Bullish Forex Trading Trend/ Upwards FX Trading Trend
When the trend in the forex market is Upward/bullish trend, then the rainbow will be moving upwards, the least smoothed line will be at the top of the indicator, this is the red line and the major smoothed line will be at the bottom of the indicator, this is the violet line.
How to Generate Forex Buy Signals Using Rainbow Charts Indicator
Rainbow Forex Charts FX Indicator Sell Forex Signal
How to Generate Forex Sell Signal Using Rainbow Charts Indicator
Steps on how to generate forex sell signals using Rainbow Charts indicator:
This Rainbow Charts indicator sell signal tutorial explains how to generate forex sell signals using the Rainbow Charts indicator as shown below:
Bearish Market/Downwards FX Trading Trend
When the Forex trend is a bearish downwards then the rainbow charts will be heading downwards, the major smoothed line (Violet) will be at the bottom & the least smoothed line (Red) will be at the top.
How to Generate Forex Sell Signals Using Rainbow Charts Indicator


