How Do You Use True Strength Index TSI MT5 Technical Indicator?
True Strength Index (TSI) Indicator Technical Analysis and TSI Buy & Sell Signals
Developed by William Blau
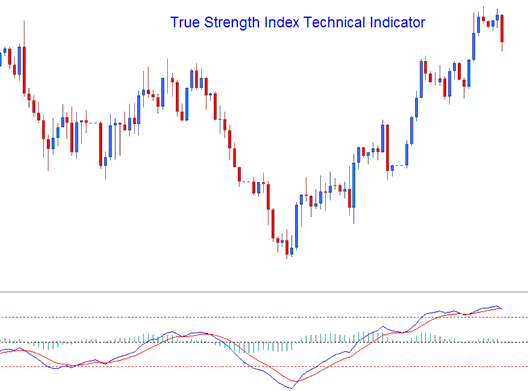
True Strength Index is a momentum indicator. The TSI is plotted by using a momentum calculation that reacts faster and is more responsive to forex price changes, making it a leading indicator that follows forex price action direction closely in the forex market.
The True Strength Index is plotted as a blue line, the indicator also plots a signal line which is plotted as a red line, and these two lines are used to generate crossover signals.
True Strength Index also plots a histogram which shows the difference between the TSI Line and the Signal line. This histogram crosses above or below the center lines, histogram levels above the center line shows a bullish crossover signal, while center line levels below the center line shows a bearish crossover signal.
How to Add MT5 True Strength Index TSI Indicator on MetaTrader 5 Charts
How to Generate Buy & Sell Signals
TTSI technical indicator uses various forex technical analysis methods to generate forex signals. TSI technical indicator can be analyzed in the same way as the RSI technical indicator to determine general forex trend direction. Overbought and oversold levels can also be shown interpreted the TSI technical indicator. The most common forex technical analysis methods of generating TSI technical indicator trading signals are:
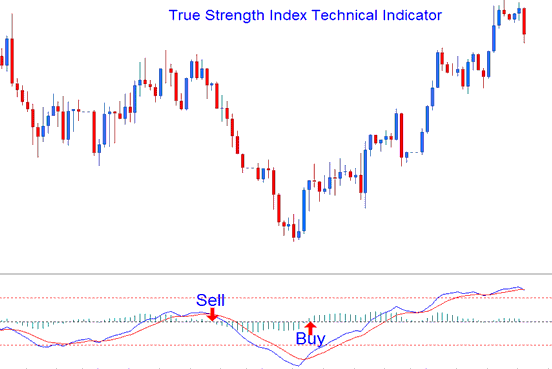
Zero line Forex Crossover ( Histogram Forex crossover not Lines FX Trading crossover)
- Buy Forex Signal - a forex trading buy signal is generated when the TSI technical indicator histogram crosses above 0 center line mark
- Sell Forex Signal - a forex trading sell signal is generated when the TSI technical indicator histogram crosses below 0 center line mark
Technical Analysis of MT5 Indicator True Strength Index TSI Technical Indicator
FX Signal Line Forex Trading Crossover
- A forex trading buy signal is generated when the TSI technical indicator line crosses above the Signal line
- A forex trading sell signal is generated when the TSI technical indicator line crosses below the Signal line
This forex trading signal is the same as the forex signal described above and the timing corresponds to the time when the TSI technical indicator histogram crossovers happen.
Divergence Forex
Divergence forex trading is used to look for potential forex trend reversal areas. The forex reversal divergence forex trading setups are:
Classic FX Divergence Trading
Classic Bullish Divergence: Lower lows in the forex price and higher lows on the TSI technical indicator
Classic Bearish Divergence: Higher highs on the forex price and lower highs on the TSI technical indicator
Divergence forex trading signals can also be used in identifying potential forex trend continuation areas in forex price direction. The continuation divergence forex trading setups are:
Hidden Forex Divergence Trading
Hidden Bullish Divergence: higher lows on the forex price and lower lows on the TSI technical indicator
Hidden Bearish Divergence: lower highs on the forex price and higher highs on the TSI technical indicator
Overbought & Oversold Levels on Indicator
Overbought and oversold levels can be used to identify the overbought and over-sold conditions in forex price movement.
- Overbought Levels - TSI technical indicator values greater than the +25 level
- Oversold Levels - TSI technical indicator values less than the -25 level
Forex trades can be generated when the TSI technical indicator crosses these overbought oversold levels.
Buy forex signal - a forex trading buy signal is generated when the TSI technical indicator crosses above -25 level.
Sell forex signal - a forex trading sell signal is generated when the TSI technical indicator crosses below +25 level.
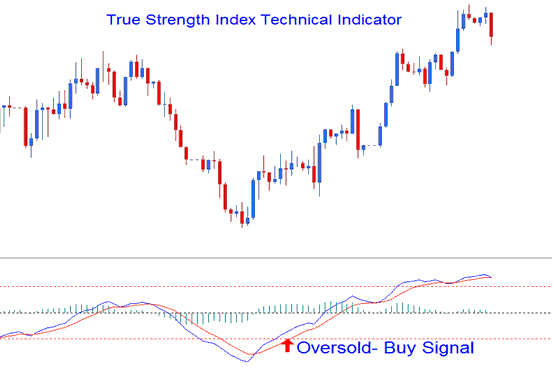
Oversold Levels
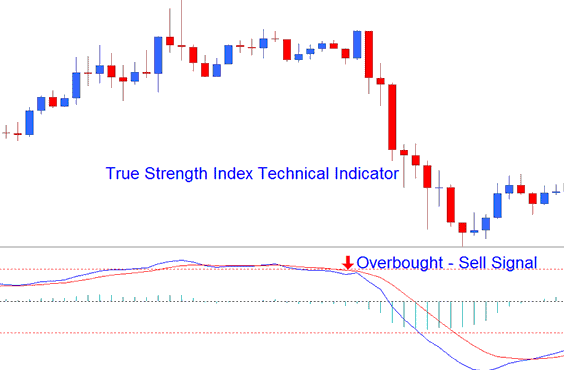
Overbought Levels
The overbought and oversold levels are displayed using horizontal lines drawn at the +25 and -25 forex technical indicator levels.
How to Add MT5 True Strength Index TSI Indicator on MetaTrader 5 Charts
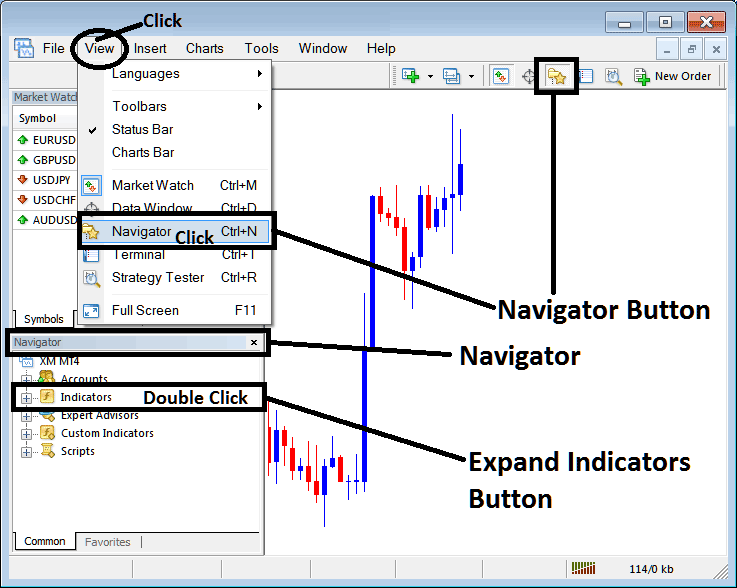
Step 1: Open MetaTrader 5 Software Navigator Window
Open MetaTrader 5 Navigator window as shown below: Go to 'View' menu (click), then select 'Navigator' window (click), or From Standard Toolbar click the 'Navigator' button or press keyboard MT5 shortcut keys 'Ctrl+N'
On MT5 Navigator window, select "Indicators", by Double Clicking
How Do You Use MT5 True Strength Index TSI Indicator?
How to Add True Strength Index TSI MT5 Indicator
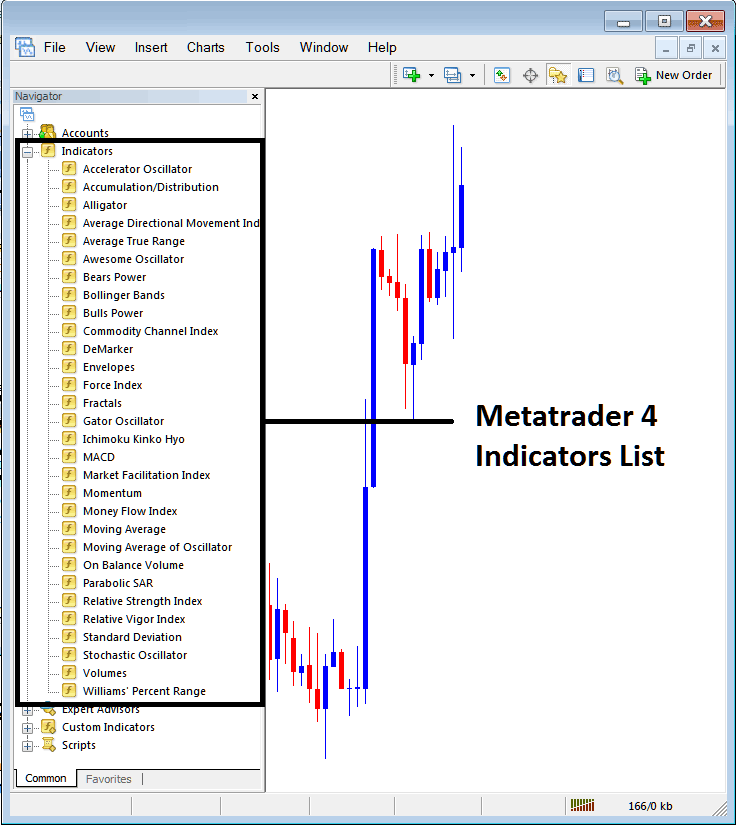
Expand the menu by clicking the expand button (+) or double click the 'indicators' menu, after this the button will appear as (-) and will now display a list of MT5 technical indicators as shown below - choose the True Strength Index TSI indicator from this list of MT5 technical indicators so that you can add the True Strength Index TSI MT5 technical indicator on the MT5 forex chart.
How Do You Use MT5 True Strength Index TSI Indicator?
How Install and Add Custom True Strength Index TSI Indicator on MetaTrader 5?
If the MT5 indicator that you want to add on the MT5 charts is a custom MT5 indicator - for example if the True Strength Index TSI technical indicator that you want to add is a custom MT5 indicator you will need to first add this custom True Strength Index TSI MT5 technical indicator on the MT5 platform and then compile this custom True Strength Index TSI indicator so that this newly added True Strength Index TSI MT5 forex custom indicator appears on the custom forex indicators list on the MT5 platform.
To learn how to add True Strength Index TSI indicators in MetaTrader 5 - how do you add True Strength Index TSI indicator window to MT5 platform? - how do you add True Strength Index TSI forex custom indicator on MetaTrader 5? - How to add a custom True Strength Index TSI custom technical indicator on MetaTrader 5.
How Do You Use MT5 True Strength Index TSI Indicator?


