Analysis of Continuation Chart Setups: How to Trade These Formations Successfully
Continuation Setup Patterns
When you see continuation patterns form on a chart, it's a pretty strong sign the current forex trend will keep moving in the same direction.
These continuation chart formations enable traders to pinpoint the approximate mid-point of a prevailing trend, as their appearance characteristically occurs precisely at the trend's halfway mark.
There are four types of continuation chart patterns:
- Rising triangle continuation chart pattern
- Falling triangle continuation chart pattern
- Bull flag/pennant continuation chart pattern
- Bear flag/pennant continuation chart pattern
Rising Triangle Continuation Chart Pattern
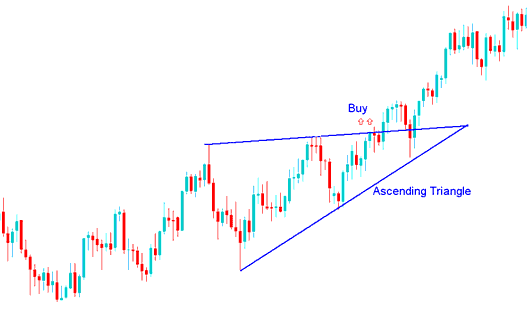
An ascending triangle forms in an uptrend. It signals the rise will keep going.
A rising triangle pattern signifies that buyers (bulls) consistently push a resistance area higher. Once this resistance is broken, the price typically follows an upward trajectory.
Resistance overhead stops the market from going higher for a while, but the rising trendline under the ascending triangle chart setup shows that buyers are still active. Going above the top line of the ascending triangle pattern is a technical buy signal for a market breaking out from an ascending triangle pattern.
Found within a upwards trend, the ascending triangle pattern forms as a consolidation period within the uptrend & indicates up side continuation will follow.

Trading the Rising Triangle Pattern - A Continuation Setup on Price Charts.
During the upward market trend, an ascending triangle pattern was formed, contributing to a continuation in the bullish direction.
You should buy when the price goes above the upper line of the ascending triangle chart pattern, and the market keeps moving upward.
Falling Triangle Continuation Chart Pattern
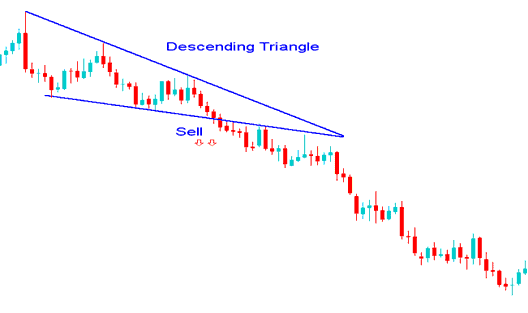
The descending triangle pattern typically materializes during a downtrend and serves as an indicator that the prevailing downward price trajectory is likely to persist.
The falling triangle pattern indicates ongoing selling pressure at a support level, and once this level is breached, a downward price trend is likely to continue.
While the descending sloping line above the descending triangle pattern shows that sellers(bears) are still active, support briefly stops the market from dropping/falling. Technical sell trading indication for a market breaking out downward from a descending triangle pattern is a down side penetration of the lower line of the descending triangle setup: this shows selling will follow.
When you see it during a downward trend, the descending triangle appears as a time when the price is not changing much during the downward trend, and it shows the downward trend should keep going.

Trading the Falling Triangle Pattern - Continuation Chart Setup.
The market made a falling triangle pattern while going down, which made it sell even more and continue going down.
The sell signal happens when the price goes below the lower horizontal line of the falling triangle pattern as sellers start pushing the market down.
Bull Flag Continuation Chart Pattern
Bull flag pattern forms what resembles a rectangle. The rectangle is formed by 2 parallel lines that act as support and resistance for the price until price breaks out. In general, the flag won't be formed perfectly flat but this pattern will be formed slanting.
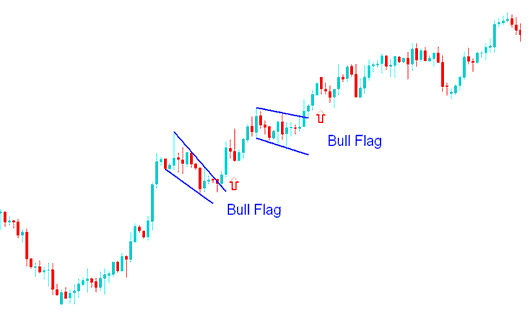
A bull flag pattern appears during an upward trend as a continuation pattern. It involves a brief retracement with narrow price action and a slight downward tilt before resuming the upward movement.
The technical buy signal is when the price penetrates the upper line of the Bull flag pattern. The flag portion has highs & lows that can be linked by small lines that are parallel, and it resembles a small channel.
A bull flag chart pattern pops up halfway through a bullish run. After the breakout, you often see a move about equal to the height of the flagpole.

How Do You Trade Bull Flag Pattern - Bull Flag Continuation Chart Pattern
The Bull Flag chart setup illustrated above represented merely a temporary pause while the market accumulated necessary energy for an upward breakthrough.
The signal to keep going with the Bull flag pattern was confirmed when the upper line of the Bull flag chart pattern was broken to the upside.
Bear Flag Continuation Chart Pattern
Bear flag pattern setup flag is found in a downwards trend.
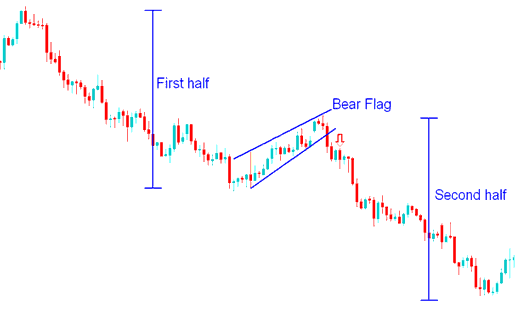
The Bear flag setup represents a continuation chart pattern where the price retraces slightly with a narrow trading range that exhibits a minor upward tilt.
A sell signal hits when price breaks below the inverted flag's lower line. The flag's peaks and dips connect with short parallel lines, like a tiny channel.

How Do I Trade Bear Flag Pattern - Bear Flag Continuation Chart Pattern
The Bear flag chart pattern above was just a resting period for market prior to more selling.
The bear flag pattern's continuation signal activated as the pattern's lower line broke downward.
Get More Courses & Lessons:
- Three Variants of Stochastic Oscillators
- Using Moving Average Envelopes
- What Occurs in Case of a Margin Call on XAU USD?
- A List of SPX500 Plans and Top SPX Plans for SPX Trading
- Forex Leverage: Comparing Maximum Leverage and Actual Trade Leverage
- Configuring Moving Averages on MetaTrader 4 Forex Charts
- How to put the zigzag trading indicator on an XAUUSD chart on MetaTrader 4 Platform
- How Do I Analyze Support and Resistance Levels in?
- MT4 Download
