RSI XAUUSD Strategies & Relative Strength Index XAUUSD Signals
The RSI technical indicator was developed by J. Welles Wilder.
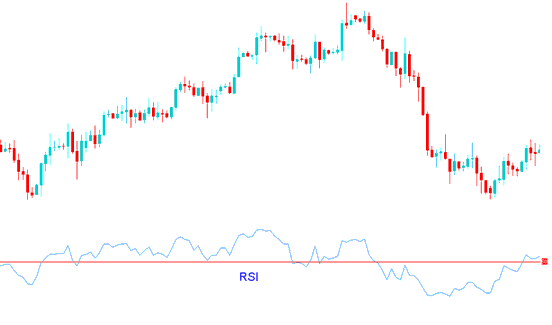
The RSI indicator is a very popular oscillator and useful momentum oscillator indicator. The RSI technical xauusd indicator compares gold price movement magnitude of recent gains against its magnitude of recent losses and calculates this information into a value that ranges between 0 and 100.
XAUUSD Strategies and RSI XAUUSD Technical Analysis
There are several technical analysis methods of interpreting RSI indicator - these are:
RSI Divergence XAUUSD:
Analyzing gold trading divergence between the RSI indicator & gold price can help xauusd traders in identifying potential xauusd trend reversal points. Open buy xauusd trade when there is RSI Classic Bullish XAUUSD Trading Divergence: Lower lows in gold price and higher lows in the RSI technical indictor; Open sell xauusd trade when there is RSI Classic Bearish XAUUSD Trading Divergence: Higher highs in gold price and lower highs in the RSI technical indicator. These types of RSI gold trading divergence signals are often indicators of a xauusd trend reversal.
RSI Overbought and Oversold Levels: RSI 80 & RSI 20 XAUUSD Strategy or RSI 70-30 XAUUSD Strategy
The RSI technical indicator can be used to identify overbought and oversold levels in gold price movements. RSI overbought levels - RSI being greater than or equal to the 70% level while RSI oversold levels - RSI being less than or equal to the 30% level - Some traders will also use the overbought and oversold levels as 80% and 20% for the RSI technical indicator. XAUUSD trades can be generated when the RSI indicator crosses these overbought and oversold levels. When the RSI technical indicator crosses above 30 level a buy signal is given. Alternatively, when the RSI technical indicator crosses below 70 level a sell signal is given.
RSI 50 level Crossover XAUUSD Trading Signal: RSI Crossover Trading Signals
When the RSI indicator crosses above 50 center mark a buy signal is given. Alternatively, when the RSI indicator crosses below 50 center mark a sell signal is given.
RSI XAUUSD Strategy PDF - The Encyclopedia of the Indicator RSI (Relative Strength Index) PDF - RSI XAUUSD Strategies Guide
RSI Trading Strategy Guide
- RSI Overbought and Oversold Levels
- RSI Divergence XAUUSD Setups
- RSI Classic Bullish & RSI Bearish Divergence Gold
- RSI Hidden Bullish and RSI Bearish Divergence Gold
- RSI Swing Failure XAUUSD Strategy
- RSI Gold Chart Patterns RSI Trend Lines
- RSI XAUUSD Summary
RSI Trading Strategy PDF - The Encyclopedia of the Indicator RSI - Best RSI Strategy - Advanced RSI Strategy Guide


