Read Gold Fibonacci Retracement Levels in MT4
How to Analyze Fibonacci Retracement Levels on XAUUSD MT4 Trading Platform
MT4 Line Studies Tool Bar - Fib Retracements Indicator - used to calculate gold price pullbacks on the xauusd chart - for example MT4 Fibonacci retracement levels indicator is shown below.
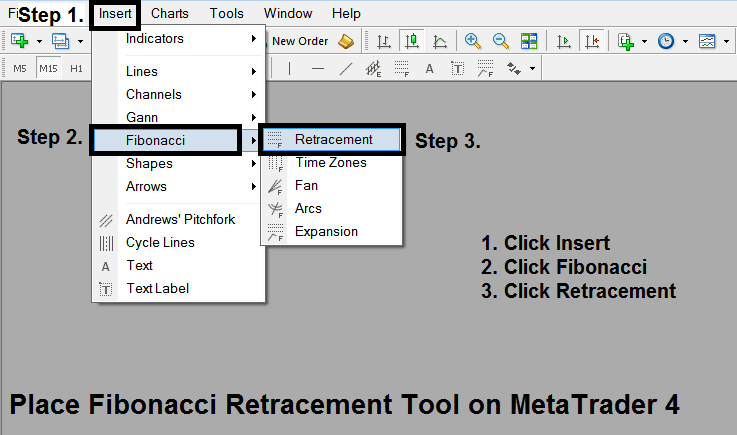
If you want to interpret xauusd charts using this fibonacci retracement levels indicator - it is already provided for in the MT4 platform. To add MT4 Fibonacci retracement levels indicator the procedure explained below is used to add this Fibonacci retracement levels tool on the MT4 Platform. On the MT4 platform - fibonacci retracement levels indicator tool will automatically draw the Fibonacci retracement levels on the xauusd chart once this xauusd indicator is placed on the gold trading chart.
To Read this fibonacci retracement indicator tool on the MT4 platform, you can use the following method to add this Fibonacci Retracement Levels Indicator:
1. Click Insert 2. Click Fib 3. Click Retracement
MT4 Line Studies Tools - Read Fibonacci Retracement Levels on MT4?
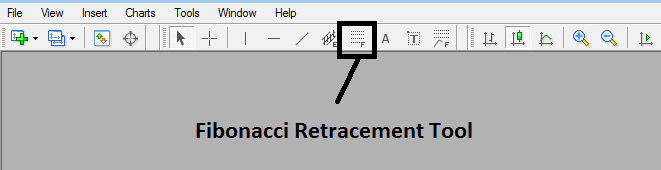
After placing this fibonacci retracement levels indicator in MetaTrader 4 platform - this fibonacci retracement technical indicator can then be accessed from "MT4 Line Studies Tool-Bar" as illustrated below.
Read Gold Fibonacci Retracement Levels in MT4?
This fibonacci retracement levels indicator is located on MT4 Line Studies Toolbar, to go to this MT4 Line Studies tool bar click "View" button key at the tops left corner of MT4 platformnext to file, then click "Toolbars", Then Check "Line Studies".
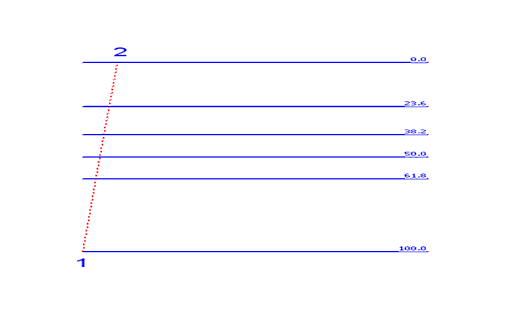
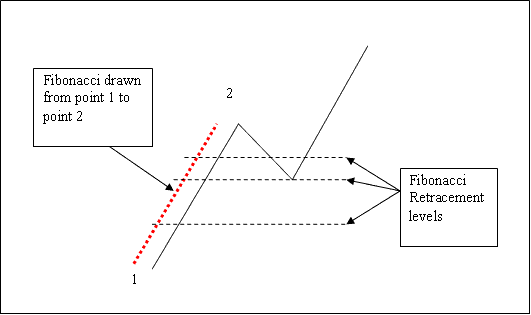
Examples of Fibonacci retracement levels indicator, the fibonacci retracement indicator is drawn between two chart points, chart point 1 and chart point 2, drawn in the direction of the trend as described below.
Analyze Fibonacci Retracement Levels on XAUUSD MT4 Trading Platform?
Analyze Fibonacci Retracement Levels on MT4 (MetaTrader 4)?
Read Gold Fibonacci Retracement Levels in MT4
To analyze this fibonacci retracement levels tool on a xauusd chart and draw the fibonacci retracement levels on the gold chart, click on the MT4 button shown above on the MT4 platform - then select 2 chart points, the first chart point is where the xauusd trend movement starts and the second chart point is where the xauusd trend pull back or xauusd trend retracement is starting.
Read Gold Fibonacci Retracement Levels in MT4?


