How to Trade RSI Divergence XAUUSD Signals
How Do You Analyze RSI Divergence XAUUSD Strategies?
RSI XAUUSD Trading Divergence XAUUSD is one of the xauusd setups used by traders. RSI Indicator XAUUSD Trading Divergence involves looking at a xauusd chart and one more xauusd indicator - the RSI indicator.
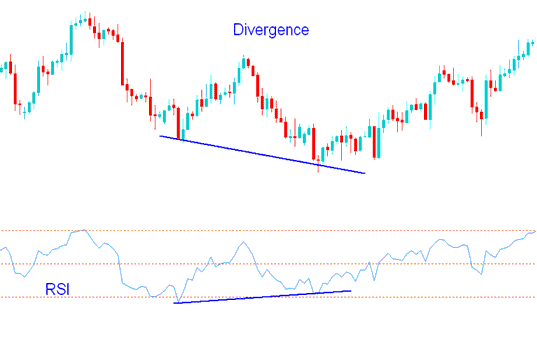
To analyze this RSI gold divergence trading setup - a trader will look to find two chart points at which gold price makes a new swing high or a new swing low but the RSI technical indicator does not - and this will indicate a divergence between gold price & momentum.
RSI XAUUSD Divergence Example - How to Analyze RSI Indicator XAUUSD Divergence - How to Trade RSI Divergence XAUUSD Signals
On the gold chart example shown below - two chart points are identified, point A and point B - swing highs.
Using RSI indicator - the highs made by the xauusd trading RSI indicator are then analyzed - these are the highs which are directly below chart point A and chart point B.
One line is drawn on the xauusd chart and another line is drawn on the RSI indicator - How to Trade RSI Divergence XAUUSD Signals? - How Do I Interpret RSI Divergence XAUUSD Strategies.
Interpret RSI Indicator XAUUSD Divergence - How to Trade RSI Divergence XAUUSD Signals
Interpret RSI Indicator XAUUSD Divergence - How to Trade RSI Divergence XAUUSD Signals
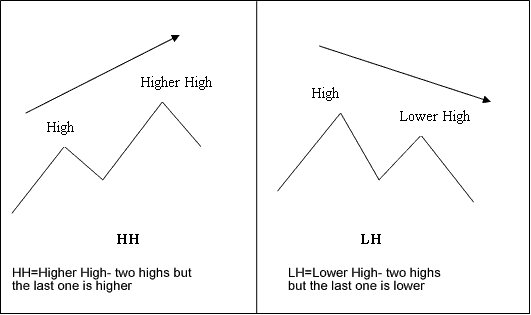
In order to trade this gold divergence set-up we look for the following set-ups:
HH = Higher High - 2 highs but the last one is higher
LH = Lower High - 2 highs but the last one is lower
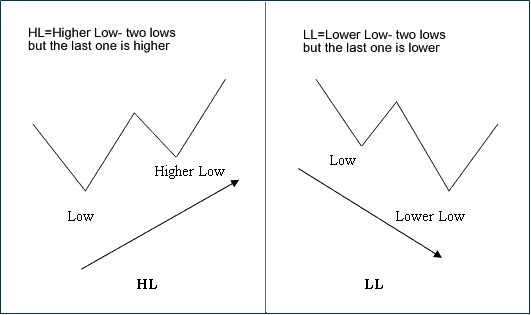
HL = Higher Low - 2 lows but the last one is higher
LL = Lower Low - 2 lows but the last one is lower
Explanations of these xauusd terms How Do You Interpret RSI Divergence XAUUSD Strategies
How Do You Analyze RSI Divergence XAUUSD Strategies
How Do You Analyze RSI Divergence XAUUSD Strategies
There are two types of gold trading divergence setups:
- Classic Divergence - RSI XAUUSD Classic Bullish Divergence & RSI XAUUSD Classic Bearish Divergence
- Hidden Divergence - RSI XAUUSD Hidden Bullish Divergence & RSI XAUUSD Hidden Bearish Divergence
Interpret RSI Indicator XAUUSD Trading Divergence


