61.8% Gold Fibonacci Projection Level
We use Fibonacci projection levels to estimate where the xauusd trend gold price movement will reach. There are 2 important Fibonacci projection levels: 61.8% Fibonacci Projection Level and 100% Fibonacci Projection Level - these fibonacci projection levels are used for setting xauusd trading taking profit orders.
61.8% Gold Fibo Projection Level
61.8 Fibo Projection Level is the most oftenly used xauusd profit-taking level when trading using the Fibonacci Projection Tool.
To draw Fibonacci Projection levels on the xauusd chart we wait until the gold price retracement is complete & the price starts to move in original direction of the XAUUSD trend. Where the gold price retracement reaches is used as chart point 3. Fibonacci Projection XAUUSD Tool is drawn using three chart points as shown on the xauusd examples displayed below of how to draw the Fibonacci Projection Levels XAUUSD Tool Tool.
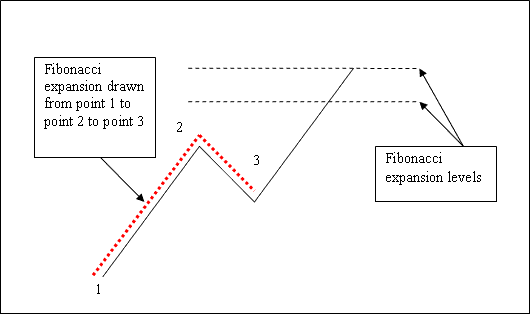
The Fibonacci projection example shown below shows the 3 XAUUSD Chart Points where the Fibonacci projection xauusd tool is drawn - marked as XAUUSD Chart point 1, XAUUSD Chart point 2 & XAUUSD Chart point 3.
XAUUSD Chart point 1 is where the xauusd trend started, XAUUSD Chart point 2 is where the price pulled back and retraced - XAUUSD Chart point 3 is where the price retracement reached as shown on the Fib Projection Levels XAUUSD Tool example shown below.
The First Fibonacci Projection Level is the 61.8 Fibonacci Projection Level shown on the Fib Projection xauusd tool example Below Used to Set Take Profit XAUUSD Orders
How to Read 61.8% Fibonacci Projection Level - How to Analyze 61.8% Fibonacci Projection Level?
Please note where these Fib Projection levels are plotted on the gold chart - Fibo Projection zones are drawn above the Fibonacci Projection xauusd tool - these are the chart points where a trader will place the gold take-profit orders using these fibonacci Projection Levels - 61.8% Fibonacci Projection Levels.
Interpret 61.8% Fibonacci Projection Level?


