Gann HiLo Activator XAUUSD Technical Analysis & Gann HiLo Activator XAUUSD Signals
Developed by Robert Krausz.
Originally used to trade Stocks and Commodities
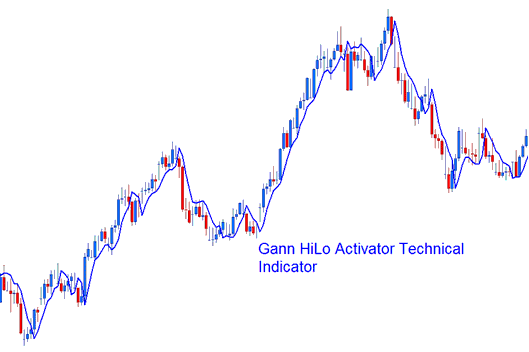
This xauusd indicator is drawn over the gold price chart.
This xauusd indicator is basically a simple moving average of the previous 3 periods highs or lows drawn based in relation to HiLo Activator.
XAUUSD Technical Analysis and Generating Gold Signals
Bullish Trading Signal- When gold price is above the Gann Activator it shows that the xauusd trend is bullish and only Buy trades should be executed. In a bullish xauusd trend this activator uses the previous periods' gold price lows for calculations.
Bearish Trading Signal- When gold price is below the Gann Activator it shows that the xauusd trend is bearish and only Sell trades should be executed. In a bearish xauusd trend this activator uses the previous periods' gold price highs for calculations.
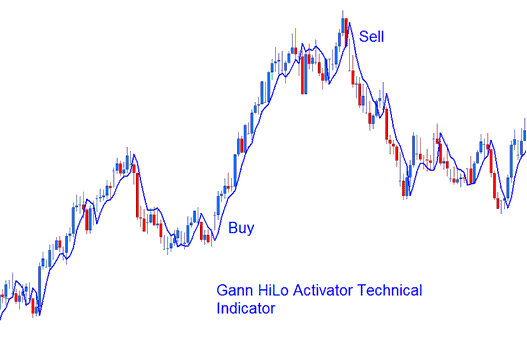
Buy & Sell XAUUSD Signal
The Gann HiLo Activator should be used in combination with the Gann Swing and Gann Trend indicator to form a gold system methodology that is oftenly referred to as "New Gann Swing Chartist Plan". Within this method the Gann Activator can be used as an entry signal or exit signal.


