What is Inertia Indicator Forex Buy Signal and Sell Signal?
Inertia FX Indicator Buy Forex Signal
How to Generate Forex Buy Signal Using Inertia Indicator
Steps on how to generate forex buy signals using Inertia indicator:
This Inertia indicator buy signal tutorial explains how to generate forex buy signals using the Inertia indicator as shown below:
Bullish Buy Forex Signal
If the Inertia is above 50, positive inertia is indicated, this therefore defines the long-term Forex trend as upward as long as the indicator remains above 50. When it crosses to levels below 50 then this is interpreted as an exit signal. The chart below shows an example of how a buy signal is generated.
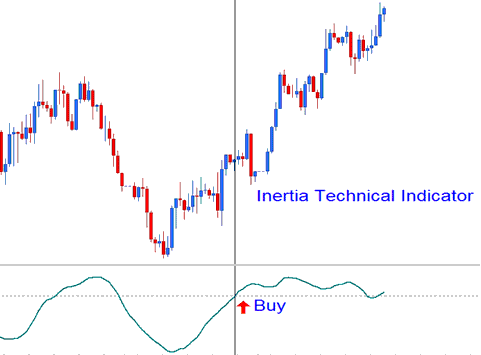
How to Generate Forex Buy Signals Using Inertia Indicator
Inertia FX Indicator Sell Forex Signal
How to Generate Forex Sell Signal Using Inertia Indicator
Steps on how to generate forex sell signals using Inertia indicator:
This Inertia indicator sell signal tutorial explains how to generate forex sell signals using the Inertia indicator as shown below:
Bearish Sell Trading Signal
If the Inertia is below 50, negative inertia is indicated, this therefore defines the long-term forex trend as downwards as long as the indicator remains below 50. If it goes above 50 then this is interpreted as an exit signal. The currency chart below shows how a sell signal generated.
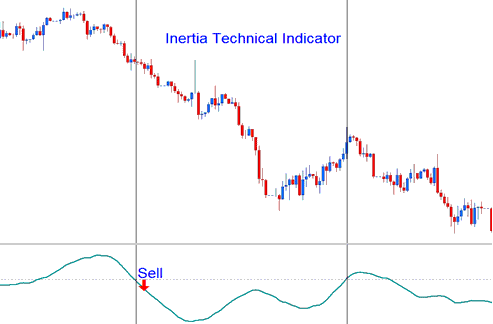
How to Generate Forex Sell Signals Using Inertia Indicator


