How to Add Bollinger Bands Fibonacci Ratios Indicator on MetaTrader 4 Charts
Step 1: Open Navigator Window on Forex Trading Platform
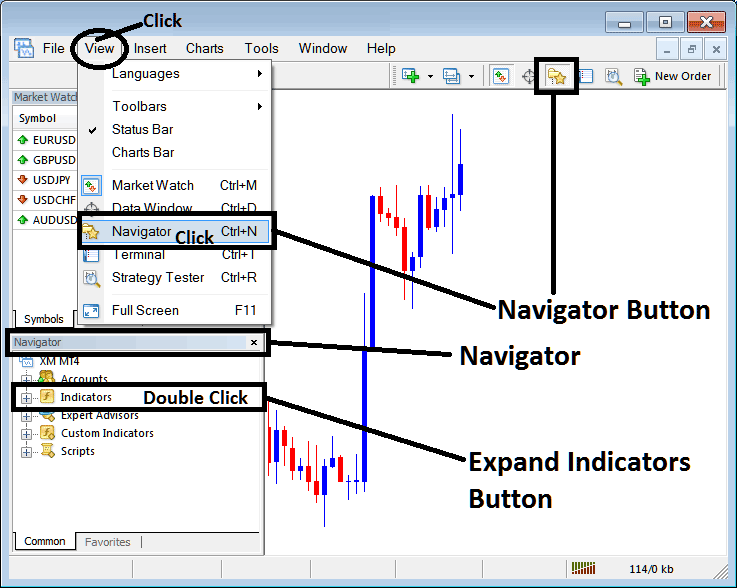
Open Navigator window as shown & illustrated below: Go to 'View' menu (click on it), then select 'Navigator' window (click), or From Standard Tool Bar click the 'Navigator' button or press keyboard short cut keys 'Ctrl+N'
On Navigator window, choose 'Indicators', (Double-Click)
How to Add Bollinger Bands - Fibonacci Ratios Indicator on MetaTrader 4 - MT4 Bollinger Bands - Fibonacci Ratios Indicator
Step 2: Expand the Indicators Menu on the Navigator - Adding Bollinger Bands - Fibonacci Ratios MT4 Indicator
Expand the menu by clicking the expand button marker (+) or double click the 'indicators' menu, after this the button will appear as (-) and will now display a list as shown below - select the Bollinger Bands - Fibonacci Ratios forex chart indicator from this list of forex indicators so that to add the Bollinger Bands - Fibonacci Ratios forex indicator on the forex chart.
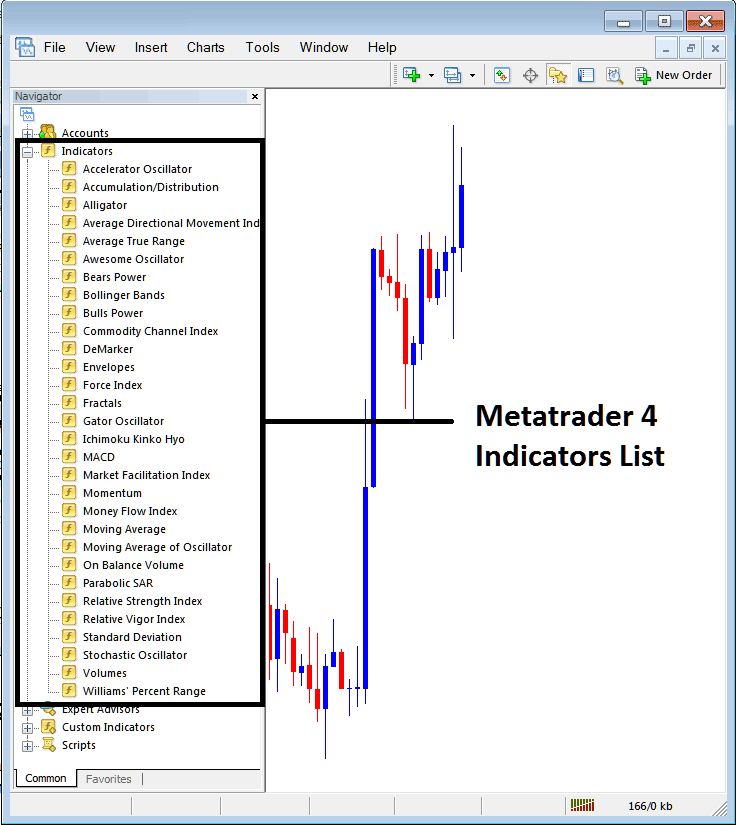
How to Add Bollinger Bands - From the Above window you can then place Bollinger Bands - Fibonacci Ratios indicator that you want on the Forex chart
How to Add Custom Bollinger Bands - Fibonacci Ratios Indicators to MT4
If the technical indicator you want to add is a custom indicator - for example if the Bollinger Bands - Fibonacci Ratios technical indicator you want to add is a custom indicator you will need to first add this custom Bollinger Bands - Fibonacci Ratios indicator on the MT4 platform & then compile custom Bollinger Bands - Fibonacci Ratios indicator so that the newly added Bollinger Bands - Fibonacci Ratios custom indicator pops up on the list of custom indicators in MetaTrader 4 software.
To learn how to install Bollinger Bands - Fibonacci Ratios indicators on MT4, how to add Bollinger Bands - Fibonacci Ratios indicator window to MT4 and how to add Bollinger Bands - Fibonacci Ratios custom indicator in MT4 - How to add a custom Bollinger Band - Fibonacci Ratios forex indicator in MetaTrader 4.
About Bollinger Bands - Fibonacci Ratios Technical Indicator Tutorial PDF
Bollinger Bands - Fib Ratios Technical Analysis and Signals
Derived from the original Bollinger bands.
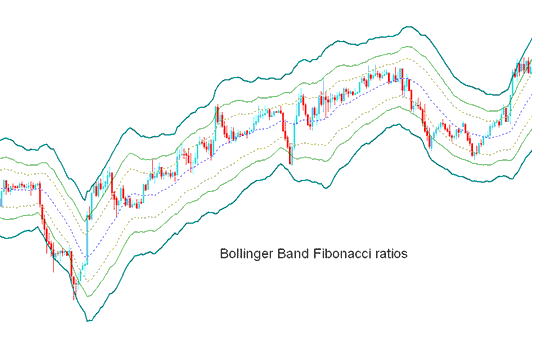
The Bollinger Fib ratios is a volatility based indicators but it doesn't use the standard deviations to calculate the width of the bands instead it uses a smoothed ATR that are multiplied with Fibo ratios of 1.618, 2.618, & 4.236.
The smoothed lines that are multiplied with Fibonacci ratios are then added or subtracted from the moving average.
This forms Three upper Fibo bands & Three lower Fibo bands
Middle band forms the basis of the market trend.
FX Technical Analysis & How to Generate Signals
This indicator used to determine point of support and resistance for a currency pair.
Lines below represent support points while those above are resistance zones.
The outermost bands provide the strongest resistance/support.
The inner most bands provide least support/resistance.
The innermost band represents Fibo 38.2% retracement level
The second band represents Fib 50% retracement level
The outermost band represents Fib 61.80% retracement level
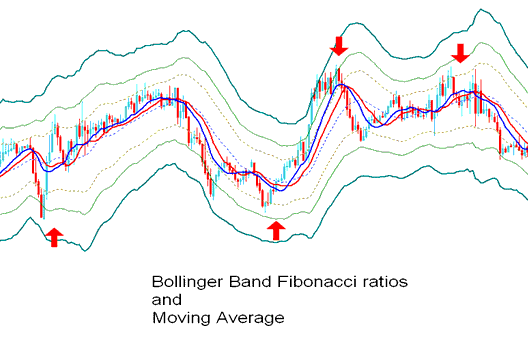
The Indicator is used to determine points where price might reverse. (Price Pullback Levels)
When price hits one of the lines & reverses then an entry or exit signal is generated.
However, it's always good to combine the signal with other confirmation indicators such as the moving average to confirm the signal as shown below.
Technical Analysis in FX Trading


