Best Momentum for 4 Hour XAUUSD Chart
How to Add Momentum Gold Indicator on MT4
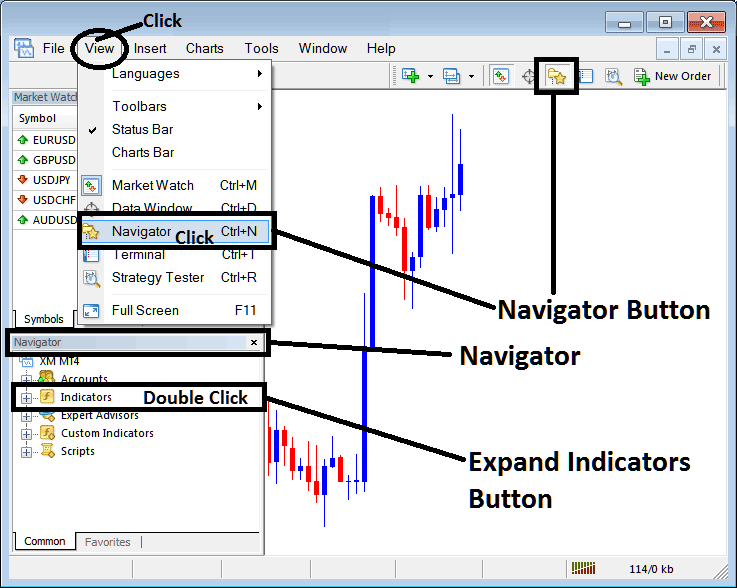
Step 1: Open the Navigator Window Panel on XAUUSD Trading Platform
Open the Navigator window as illustrated & shown below - Go to "View" menu (then click) and then select "Navigator" window (click), or From the Standard Tool Bar click the "Navigator" button key or press short cut keyboard keys "Ctrl+N"
On the Navigator window, choose 'Technical Indicators', (DoubleClick)
Best Momentum for 1 Hour Gold Chart - Best Momentum for 4 Hour XAUUSD Chart
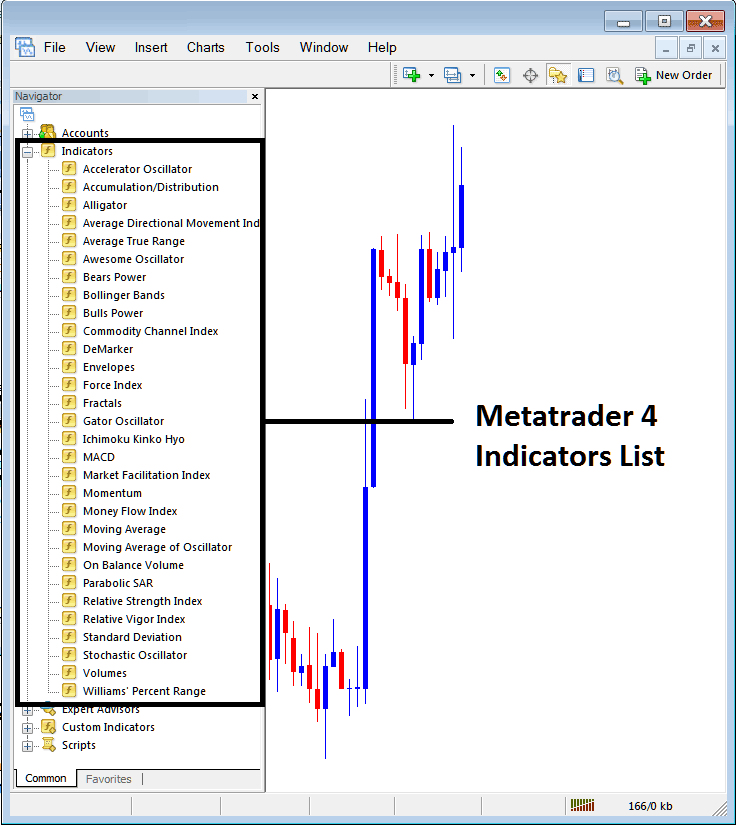
Step 2: Expand the XAUUSD Indicators Menu on the MT4 Navigator
Expand the menu by clicking the expand button marker (+) or double click the "indicators" menu, after this the button will appear as (-) and will now display a list as shown below - select the Momentum indicator from this list of xauusd indicators so as to add the Momentum technical indicator on the gold trading chart.
Best Momentum for 1 Hour Gold Chart - Best Momentum for 4 Hour XAUUSD Chart
How to Add Custom Momentum XAUUSD Indicator to MT4
If the technical indicator you want to add is a custom MT4 Momentum indicator - for example if the Momentum technical indicator you want to add is a custom indicator you will need to first add this xauusd custom Momentum indicator in MetaTrader 4 software and then compile custom Momentum indicator so that the newly added Momentum gold custom indicator appears on the list of custom indicators on the MT4 platform.
To learn how to install Momentum technical indicator on MT4, how to add Momentum indicator window to MT4 and how to add Momentum xauusd custom indicator on MT4 - How to add custom Momentum xauusd trading Indicator in MetaTrader 4.
Momentum Gold Technical Indicator Described
Momentum Gold Technical Indicator Technical Analysis & Momentum Oscillator Trading Signals
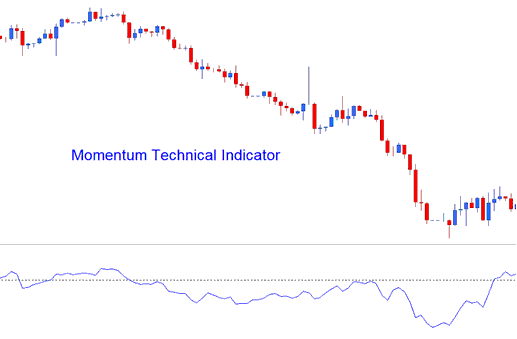
The momentum xauusd technical indicator uses mathematical equations to calculate the line of plotting this technical indicator. Momentum technical indicator measures the velocity with which gold price changes. This is calculated as a difference between the current gold price candlestick & the average gold price of a chosen number of previous gold price bars.
Momentum indicator represents the rate of change of the gold price over those specified time periods. The faster the gold prices rise, the bigger the increase in momentum. The faster the xauusd prices decline, the bigger the decrease in the momentum.
As the gold price movement starts to slow down the momentum will also slow down and return to a median region.
Best Momentum for 15 Minute Gold Chart - Best Momentum for 5 Min XAUUSD Chart
Momentum XAUUSD Technical Analysis and Generating Momentum Gold Signals
Momentum technical indicator is used to generate technical buy and sell signals. 3 most common strategies of generating xauusd signals are:
Momentum XAUUSD Technical Indicator Zero Center line Crossovers XAUUSD Trading Signals:
- A buy signal is generated when Momentum indicator crosses above the zero
- A sell trading signal is generated when Momentum indicator crosses below zero
Momentum Gold Trading Indicator Overbought and Oversold Levels:
Momentum indicator is used as an overbought oversold trading indicator to identify potential overbought and oversold levels based on previous trading indicator readings: the previous high or low of the momentum trading indicator is used to determine the overbought and oversold levels
- Momentum XAUUSD Indicator Readings above the overbought level mean the gold price is overbought and a gold price correction is pending
- While Momentum technical indicator readings below the over sold level the gold price is oversold & a gold trading price rally is pending.
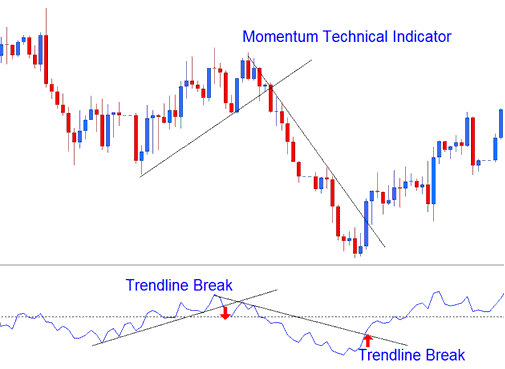
Momentum XAUUSD Trend-Line Break-outs:
XAUUSD trend lines can be drawn on the Momentum indicator connecting the peaks and troughs. Momentum indicator begins to turn before gold price thereby making it a leading xauusd indicator.
- Bullish xauusd reversal - Momentum technical indicator readings breaking above a downward indicator trend-line warns of a possible bullish xauusd trading reversal signal while
- Bearish xauusd trading reversal - Momentum indicator readings breaking below an upward indicator trend line warns of a possible bearish xauusd trading reversal signal.
Best Momentum for 15 Minute Gold Chart - Best Momentum for 5 Min XAUUSD Chart


