Accumulation Distribution Technical Analysis and Accumulation/Distribution Signals
Created and Developed by Marc Chaikin
This indicator evaluates the total flow of money into and out of XAU/USD.
Originally used for trading stocks, "volume" is the number of shares traded in a specific stock: this number directly shows how much money is being invested in, or taken out of, the stock.
The main thought behind AD is that volume (or how money flows) tells you where prices might head. (Volume comes first).
Tick volume tracks every price change - every tick - that your broker receives during a certain time. Most brokers include tick volume in their charting tools.
Interpretation
This particular volume indicator assists in determining whether trading volume is expanding or contracting in tandem with the price movement (upward or downward) depicted on the chart.
UpXAUUSD Trend
If the price on the chart is ascending, the Accumulation Distribution line should mirror this upward movement, confirming that volume is supporting the price action, lending strength and sustainability to the advance.
If price rises but volume stays flat, momentum fades. This creates divergence between price and indicator. It signals a potential shift in trend.
DownGold Trend
If chart prices fall, the AD line should drop too. This means volume backs the slide with real force.
If the price is dropping but the volumes aren't, the move's strength is lessening: this makes a difference between price and AD and warns that the trend could go in the other direction.
XAUUSD Analysis and How to Generate Trading Signals
Below is an example of a chart and the trading analysis explanation

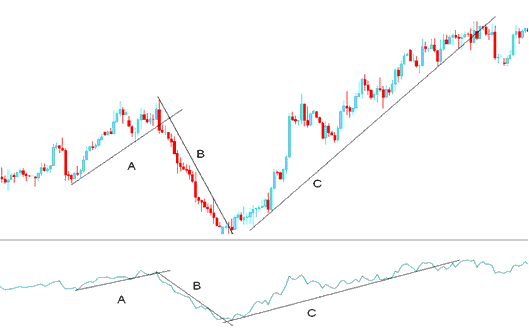
From the chart, we divide it into three parts: A, B, and C.
A - Upward trend-line on the chart and also on the AD
B - Downward trend-line on the chart and also on the AD
C - Upward trend-line on the chart and also on the AD
As long as the price & the indicator are heading in the same direction then price move has enough energy to continue moving in that particular direction as is displayed above
TrendLine Break
Determining risk per trade: Select the precise number of Pips you plan to set for the forex stop loss order applicable to your active trades.
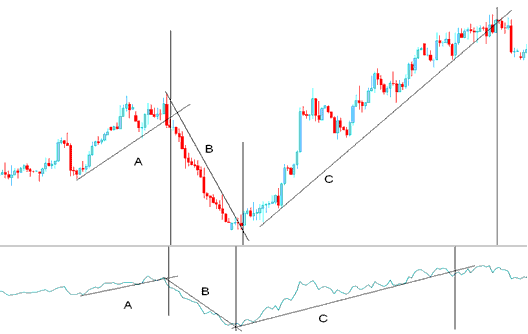
The chart below includes vertical lines to mark where trend lines broke on both the price graph and the indicator.
Comparing the trendlines on the indicator and the price those of the AD indicator were broken before those of the chart. This is because volume always precedes price.

Signals
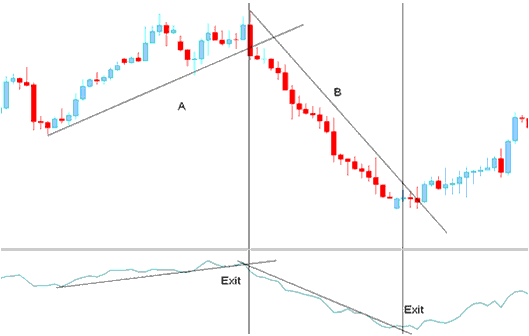
Exit
Egress signals are generated and identified when the trend delineation on the Accumulation Distribution indicator is breached. A break in the xauusd trend line on this indicator signals a potential trend reversal.

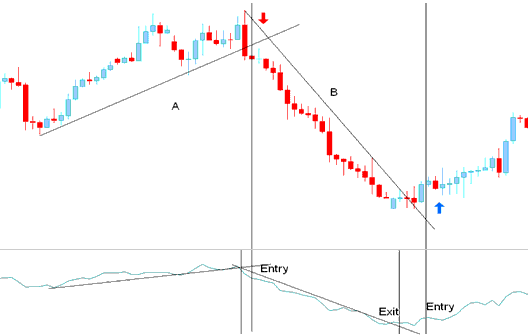
Entry
When the trend line associated with the AD (Advance/Decline line) is breached, it signals a potential shift in the market's current direction.
But if we decide to make a move that goes against what's generally happening, we must first make sure it's really happening.
A definitive confirmation signal is achieved when both the indicator and the price action successfully breach their respective trendlines.

Entry Signal Derived/Generated by Trend Reversal
Discover More Lessons, Tutorials, and Courses
- What's 1:25 XAU/USD Leverage in Gold Trading?
- Guide to Analyzing and Interpreting Charts within MetaTrader 4
- What's FX Trend Trigger Factor TTF Indicator?
- How to Use MT5 Rate of Change, ROC Indicator
- Which Online Broker Can You Use to Trade Nikkei 225?
- What's 1:50 XAU/USD Leverage in Gold Trading?
- Classic Bullish and Classic Bearish Divergence Analysis for Gold (XAU/USD) Using RSI
- Gold Indicators to Set Stop Losses on XAU/USD Charts
- How Do You Use Darvas Box Indicator in FX?
- Trade UKX100 Stock Indices System
