
Drawing Upwards TrendLines & Channels
An upward trendline is constructed on the Gold chart when the general direction of prices is ascending. To draw this line, at least two points marking the lows of the upward price movement are connected: this line subsequently illustrates that the prevailing market direction is bullish.
The example below explains this idea and shows how prices change when they are generally going up. When the market is going up, it makes new support areas as it goes, and these support areas are used to draw the line showing the upward trend.
Markets move in zigzags, so traders draw trendlines for the overall up direction.
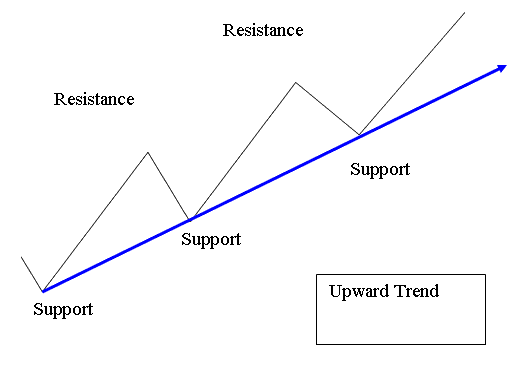
Upward Trending Market
An upward trend happens when the prices of Gold continue to create back-to-back higher highs & higher lows. Each high is greater than the high before it - higher high, & each low is greater than the low before it - higher low.
Up trend lines strengthen when gold price touches but skips crossing them. The uptrend holds until higher highs and lows break.
A break below an uptrend line signals a sell. It often means the uptrend may end or pause.
Drawing an upward Trend-Line
When the Gold market goes up, it makes higher highs and higher lows, which creates an upward price movement. An upward trend-line can then be drawn by connecting the higher lows together.
To properly chart this specific setup, we rely on existing price support levels. Drawing an upward-sloping trend line correctly necessitates identifying at least two distinct support points. When the price interacts with this established upward trend line, the instruction is to initiate a buy order, placing a protective stop loss just a few pips below that line. An illustration of an upward trend line is provided below.
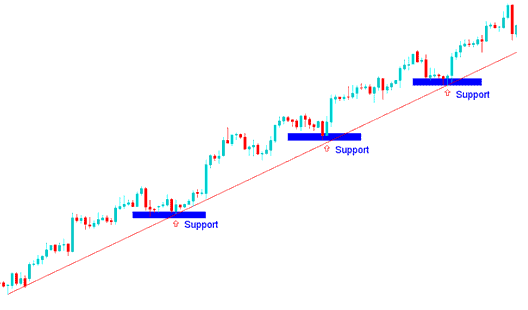
Upward Trend-Line - Gold Trading
The trendline setup will indicate that the Gold market is generally going up, so traders will only start buy trades if the price stays within this setup and the support levels. These levels are where the price will likely find strong support if it falls back down. That's why many buyers will wait for the price to drop and reach these support areas before they start buy trades.
Trades initiated at these levels exhibit a very high risk-to-reward ratio and tend to be quite profitable.
In this setup, an online trader would enter buy or long positions from signals at support levels one, two, and three. These trades often yield strong profits with little drawdown. That's why many traders favor this trendline method.
Drawing Upwards Channel
Draw an upward channel by creating a line parallel to the upward trend line. Adjust this new line to touch the top of the price movement. This creates a price channel. As long as prices stay between these two lines, the bullish move in gold prices will keep going up.
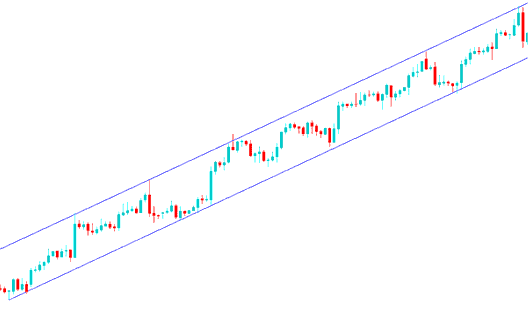
Upward Channel - XAUUSD Gold Trading
Trading the Upward XAUUSD Gold Prices Channel
Gold traders use this upward channel to set take-profit levels. They lock in gains when price hits the top. Then they wait for a pullback to buy again.
Tools in MetaTrader 4 for drawing upward trend lines and channels
Within the MT4 software, the tools necessary for creating these setups can be found on the MT4 drawing toolbar. If this toolbar isn't visible, you can enable it by clicking "View" located next to "File" in the top left corner of MT4. Then, select "Tool Bars" and check the option for the "Lines Tool Bar" by clicking on it.
Presented below is the image of the toolbar for drawing trendlines in MT4. To create a trendline on a Gold chart, simply select this tool and pinpoint the area you, as a trader, wish to outline.
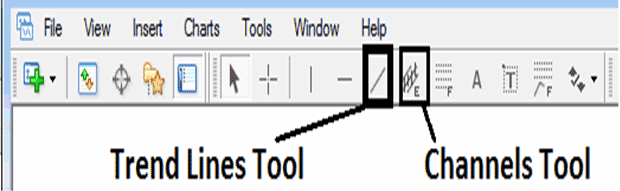
MT4 Tool-Bar for Drawing Upward Trend-Line and Channels
Learn More Tutorials and Lessons & Topics:
- Putting Gann Lines on charts in MetaTrader 4 software.
- A Full How-to on Day Trade Plan for Stock Numbers
- XAU/USD Chart Time-frames MetaTrader 4
- USDJPY Market Hours from Open to Close
- Methodology for Interpreting and Analyzing Strategies Based on FX Candlesticks Patterns
- MA Trade Forex EA
- Trading XAU/USD: Strategies and Lessons
- GBPNZD Bid-Ask Spread
- USD/DKK Spread Explanation
- How to Build a Trade Strategy Using Indicators