
Candle pattern indicator - Candlestick analysis PDF - Setup patterns PDF
Candlestick Patterns with Examples: Basic Analysis
The Complete Catalogue of Candlestick Setups for Technical Analysis - Illustrations of Various Candlestick Patterns:
A list of candlestick patterns for trading Forex - The 10 most common candlestick patterns for trading on the internet market.
Doji Candle Setups with Examples
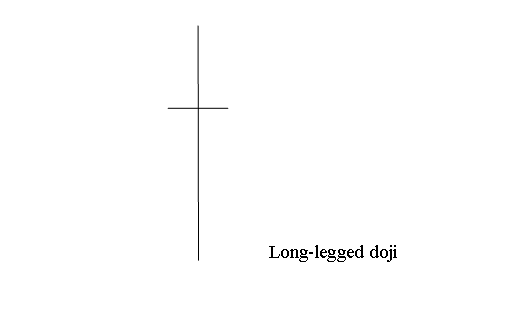
A doji candlestick shows the same open and close price. Charts display various types of doji patterns.
These Images Show Various Doji Candlestick Forms
The Long-legged doji Candlestick Setup has long lines above and below with the opening and closing price in the middle. When Long legged doji appears on a trading chart it shows that currency traders, both the buyers (bulls) and the sellers (bears), are not sure.
Displayed Below is illustration of Long Legged Doji candlesticks setup
Doji Pattern - Doji Candle Patterns Defined with Examples
Doji Pattern - Doji Candle Patterns Defined with Examples
Marubozu Candlestick Guide - Examples and Lessons on Candle Patterns
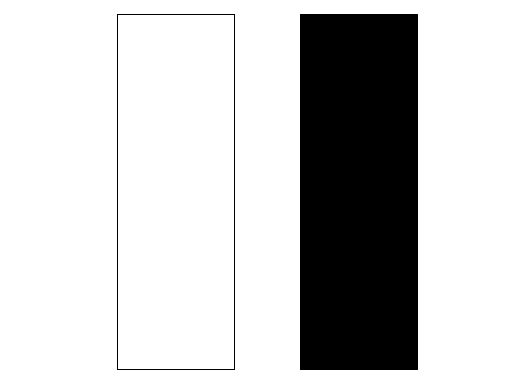
Candlesticks known as Marubozu are characterized by their elongated bodies, lacking any upper or lower shadows (wicks), similar to what is depicted in the following examples.
Marubozu Candles - Marubozu Candle Setups Tutorial Guide - Candle-sticks Setups Explained with Examples Guide
The Marubozu Candlestick Pattern consists of candle shapes that suggest the price will keep moving in the same direction as the Marubozu candle indicates. These candles can be white/blue or black/red, depending on which way the market price trend is heading.
Spinning Tops Candlestick Setups Lesson
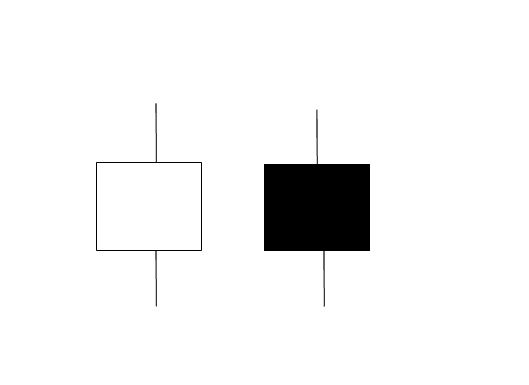
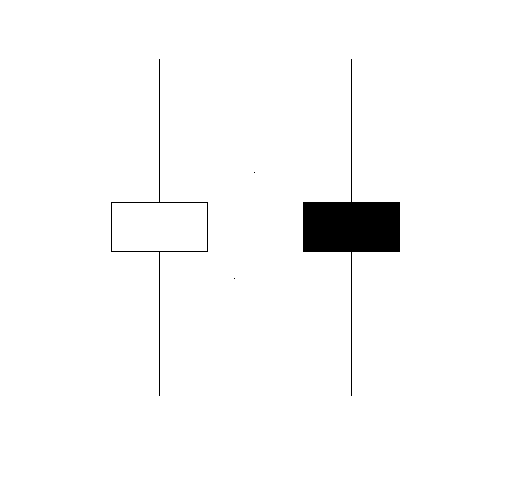
Spinning tops candlestick setups have a small body coupled with long upper and lower shadows. These candles are named for their resemblance to spinning tops balanced on matchsticks.
The top and bottom shadows of the spinning top candle patterns are longer than the main body. The picture shown below displays what the spinning top Candle Pattern looks like. You can search for this pattern on your MT4 Software charts. The picture shown below is a screenshot to help traders study and understand this Candle Setup.
Mastering Candle Chart Reading - Guide to Spinning Tops and Candlestick Setups with Illustrated Examples
The colour of spinning top candlestick fx candlesticks setup isn't important, this formation shows indecision between buyers and the sellers(bears) in the trading market. When these setups appear at the top of a trend or at the bottom of the trend it may signify that the trend is coming to an end and it might soon reverse and start going in the opposite trend direction. However, it is better to wait for additional confirmation trading signals that direction of a currency has reversed before taking the signal from the trading Candle Pattern formation.
Hammer vs. Hanging Man Candlestick Patterns: An In-Depth Look into Candlestick Setups
The Hammer Candlestick and the Hanging Man Candlestick setups appear alike, but the Hammer indicates a bullish reversal while the Hanging Man signifies a bearish reversal.
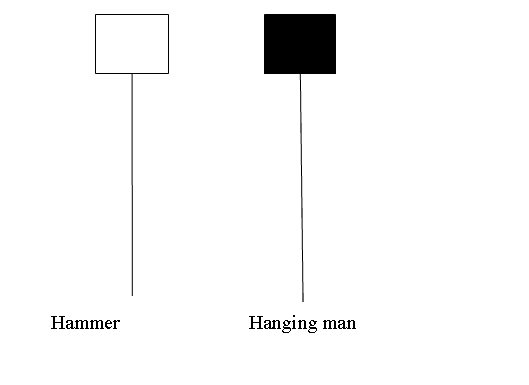
The Hammer Candlestick Pattern and the Hanging Man Candlestick Pattern are explained in detail within the Candlestick Setups Guide, which includes descriptive examples and instructional content.
Hammer candle setups guide - Candlestick patterns with examples
The possible bullish candlestick arrangement called Hammer Forex Candlestick Setup occurs throughout a downturn. The market is hitting a bottom, thus the moniker.
Hanging Man Candlestick Pattern Guide - Examples and Setup Lessons
This hanging man forex Candle Setup is a potentially bearish reversal that happens during a uptrend. It's called & named so because it looks like a man hanging on a noose up high.
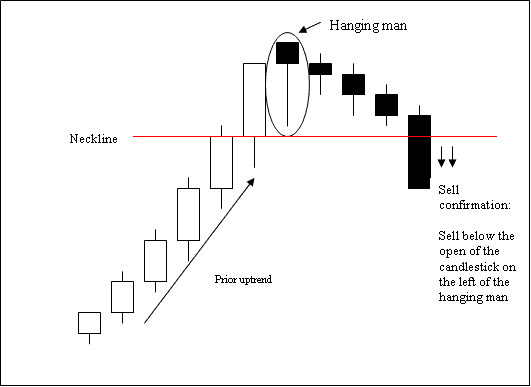
Hanging Man Candlestick Setup - Candle-sticks Setups Examples Explained
Inverted Hammer Candlestick Tutorial - Key Candle Patterns Explained
This is a bullish reversal trading Candle Setup. It forms at the bottom of a trend.
The Inverted Hammer Candlestick Pattern appears at the end of a downtrend, signaling a potential reversal in the downward price movement.
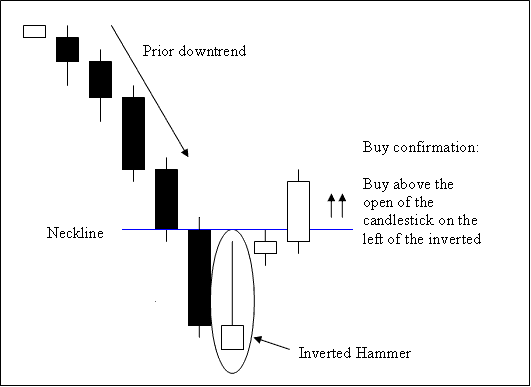
Inverted Hammer candlestick: Part of setups course with examples.
Shooting Star Candlestick Patterns - Guide with Examples and Lessons
The Shooting Star Candlestick constitutes a bearish reversal trading Candle Setup, typically forming at the peak of a market trend.
Shooting Star Candlestick Pattern occur at the top of an uptrend in the market where the open price is the same as the low & price then rallied upward but was forced back downward to close the open.
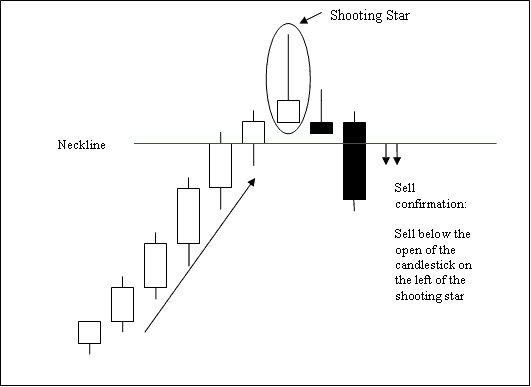
Shooting Star Candlestick - Candlesticks Setups Guide Explained and Described - Candle-sticks Setups Explained with Examples Guide
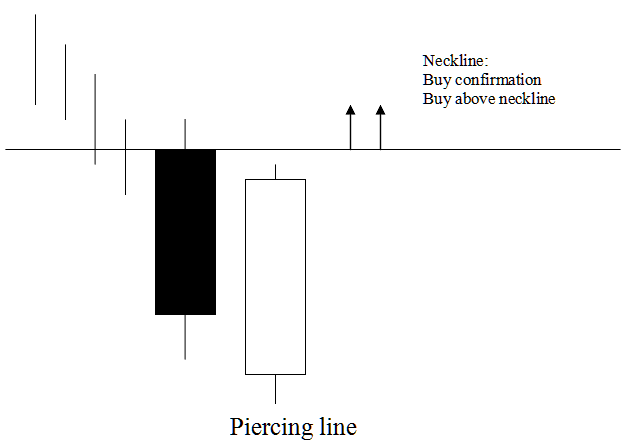
Piercing Line Candle Patterns Explained - Candlestick Lessons with Examples
The piercing line candle setup originates with a long dark candlestick followed by a long light-colored candlestick.
The white body pierces the mid-point of previous black body.
The Piercing Line Candle Pattern is a bullish reversal setup that typically forms at the end of a downtrend. It signals that the market opened lower but closed above the mid-point of the prior bearish candle.
This Piercing Line candle signals fading downtrend momentum. The market may soon turn and head upward.
This specific candlestick arrangement, termed the Piercing Line, is identified as a signal indicating that the market is breaking through the lower boundary, suggesting the establishment of a temporary floor for the currency pair's downward trend.
Explanation of the Piercing Line Candle Pattern - Instructional Guide with Practical Chart Examples
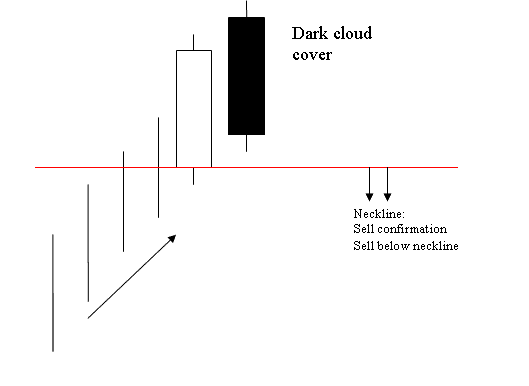
Detailed Guide and Examples Explaining the Dark Cloud Cover Candlestick Formation
Opposite of piercing candlestick candlestick.
This candlestick is a long white body that is followed by a long black body.
The black body pierces the mid-point of the prior white body.
This is a bearish reversal setup which forms at the tops of an up-trend.
Dark Cloud forex Candle Setup that the market opens higher and closes below the midpoint of the white body.
The Dark Cloud Candlestick Pattern shows the uptrend is getting weaker, and the market will probably change direction and start going down instead of up.
The Dark Cloud forex Candlestick Setup is seen as cloud cover, which means the cloud is like a ceiling preventing the currency price from going up.
Explanation of the Dark Cloud Cover candlestick formation, complete with illustrative charting examples.
Morning Star Candlestick Patterns Guide - Examples and Lessons on Candle Setups
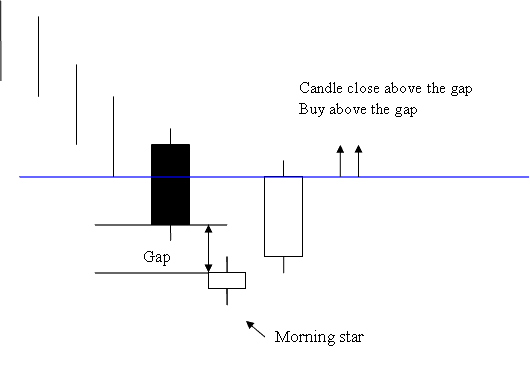
Morning Star Candlestick Setup - Candle-sticks Setups Tutorial Guide - Candle-sticks Setups Explained with Examples Guide Lesson
Evening Star Candlestick Guide - Examples and Lessons on Candlestick Patterns
Opposite of morning star candlesticks setup
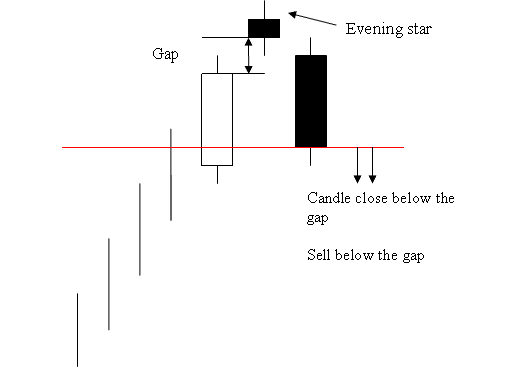
Evening Star Candlestick Setup - Explaining patterns with examples to better understand candlestick setups.
Engulfing Candle Patterns Guide with Examples
The engulfing candlestick pattern indicates market reversals and can be bearish or bullish based on its occurrence either at the end of a downtrend or an uptrend.
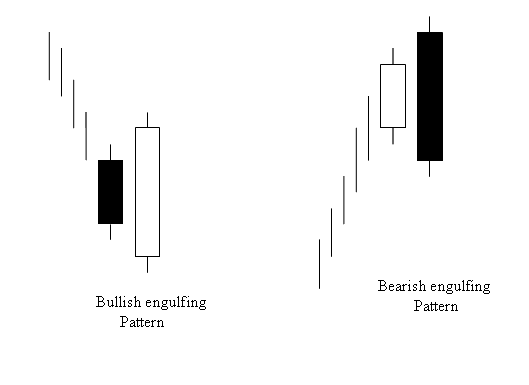
Guide and Lesson Explaining Bullish and Bearish Engulfing Candle Setups - Examples of Candlestick Setups
Candlestick Pattern Analysis Guide - Candlestick Setups Technical Analysis
Get More Lessons and Tutorials and Courses:
- Top FX Brokers for Beginners
- Steps to Get MT4 SX5E Index Trading Chart Access
- List of DAX30 Strategies
- Need a EUR/AUD trading strategy? I've got one for you.
- What is a margin call in relation to XAUUSD?
- Learning About Morning Star Candlestick, Evening Star Candlestick and Engulfing Pattern Candle
- Chaos Fractals Trading Analysis on Forex Charts
- Trailing Stop Loss Levels: How This Trading Indicator Works
- Using Demarks Projected Range XAU/USD Indicator for Analysis