Technical Review of DeMarks Projected Range Indicator and Related Trading Signals
Developed by Tom Demark.
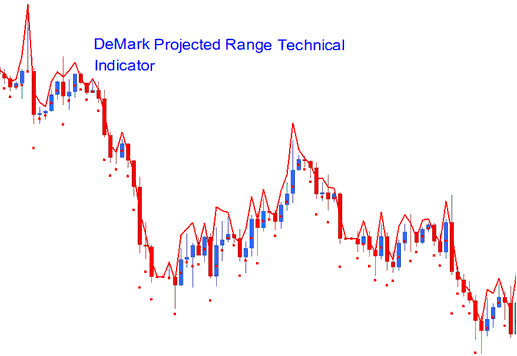
This indicator serves to indicate the potential high and low prices that a chart price is expected to reach.
This is called the range projection, and we find it using the starting and ending prices from the most recent time period.

Projected Range by DeMark
Technical Analysis and How to Generate Trading Signals
This indicator will display two values, the anticipated high and the anticipated low for a specific price period. These values will serve as reference points.
Bullish Up trend Signal
If the next candle opens over the projected high, trends keep rising.
Bearish downward trend Signal
If the subsequent price bar opens beneath the expected low, then the market will persist in a downward trend.
Ranging Market
If the next candle opens in the expected range, it signals a range-bound market ahead.
Find More Tutorials, Lessons, and Topics
- Trendline Break Trading Gold Trendline Reversal Signals
- Adding NKY 225 in MT5 on PC: How to?
- XAU/USD Leverage and Margin Trade Explanation & Examples
- How to Trade Stock Index with MACD Center-Line Crossover Strategy
- Information on MetaTrader Software for the SWI20 Index in Forex
- Programming MT4 Meta-Editor Course Tutorial: Adding MT4 Custom Indicator
- Bullish Divergence FX System & Bearish Trade Divergence System
- How to Locate EUROSTOXX 50 on MT5 Desktop
- How Do You Analyze/Interpret Forex in MetaTrader 5 Platform?
- Trade Forex AUD CAD Pip Calculator
