Ehlers Fisher Transform Stocks Technical Analysis and Ehlers Fisher Transform Stocks Signals
Developed by John Ehlers,
Ehlers Fisher Transform has 2 lines, the Fisher Transform line and the trading signal line: signals are generated when there's a cross-over of these 2 lines which looks like the stochastic oscillator.
It was designed to define major stocks price reversals using the rapid response time and sharp, distinct turning points making it a leading indicator.
This stocks indicator is based on the assumption that stocks prices do not have a Gaussian probability density function (bell shaped curved movement), but that by normalizing stocks price and applying the Fisher Transform you can create a nearly Gaussian probability density function on the lines drawn.
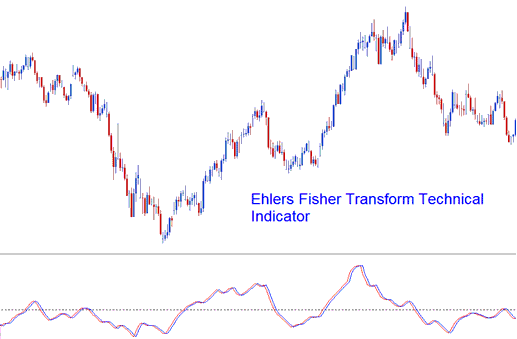
Ehlers Fisher Transform
Stocks Technical Analysis & How to Generate Signals
Trading signals can be generated with pin-point accuracy by using the cross over points of the Fisher Transform & its signal line.
However, this Ehlers Fisher Transform isn't very accurate, as with all leading technical indicators, it gives many false trading signals and it is prone to whipsaws, it's therefore recommended to trade it in combination with other indicators.


