Indices Trade System
The Best method of trading Stock Indexes is to use a trading system & combine it with the pullback entry strategy. This is the best method to ensure that your risk: reward is high enough thus improving your chance of making more profits from trading Stock Indexes trade charts.
The Pull Back - Retracement
As a trader even before implementing you trade system you want to wait for a pull back, but how does a pullback look like - The price pullback is shown and illustrated below.
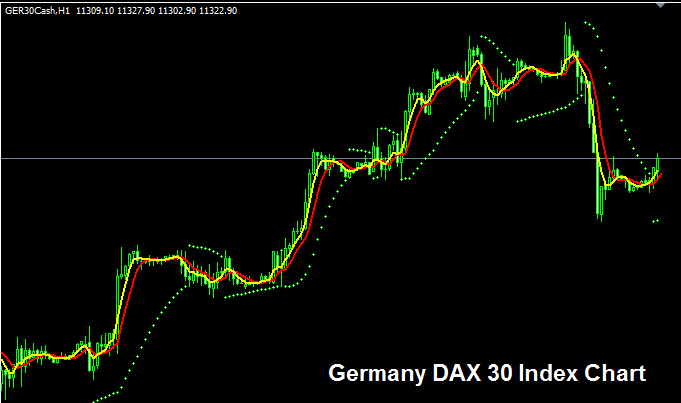
In the above example the chart is of Germany DAX30 Index - The 1 Hour chart timeframe is used to look for a price pullback. In this stock index chart the long term trend is upward - in addition the main fundamental strategy that is being used for Germany DAX30 and all European Stock Indices at the time of writing is QE - we shall explain this on our market sentiment for indices tutorial. For now let's continue with the explanation of our trading strategy.
For the above setup, you can see there was a pullback on this stock index, but now the moving averages have turned & are starting to move upward - this is our entry signal where as a trader you open a buy trade on this stock index. You can also add another indicator like the RSI to confirm this signal.
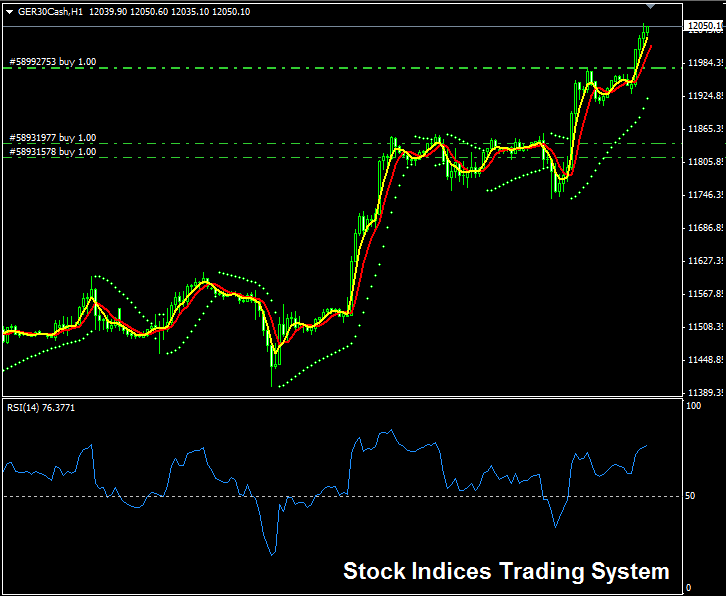
From the above example - we waited for a price pullback, this pullback quickly reversed & the uptrend continued, the moving average turned up & RSI moved to above 50 confirming our buy signal, a buy trade was then opened at the level of 11,810 and this upwards trend continued up to the index level 12,050. All these time our trading system shows the upwards trend was gaining momentum as the two indicators, the Moving average crossover system kept moving up & the RSI indicators remained above 50 mark - RSI levels above 50 means that prices are closing higher than they opened.
Take Profit
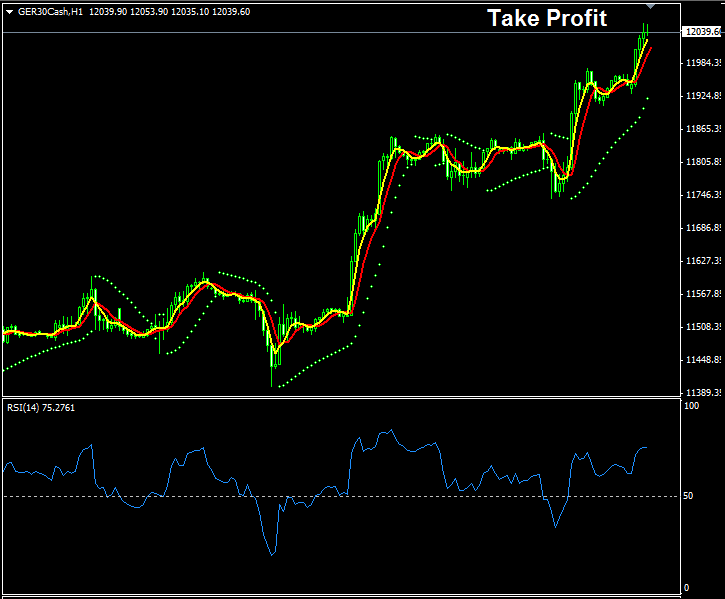
At the same time on this setup, since our trades are in profit, we want to take profit while we are still ahead. Note that our trading system is showing the market signal is still a buy but because we want to book our profit while ahead we shall close this trade. This trade has moved 2,400 points in our favor making a profit of 236 dollars per lot. We had opened 2 lots making a total profit of about $560 dollars, we had also added 2 more lots at 11,980 and for these we made some additional 700 points profit.
Remember for Indices 1 pip per lot is equal to 0.1 dollars & not 10 dollars per pip like in Forex. However, the market daily market moves for indices is about 500 to 2000 points while forex daily pip movement is average of 50 to 100 points - therefore in indices even though the market moves are about 2000 points, the profit per point is only 0.1 dollars - therefore when trading indices if you make a profit of 2000 point the total profit in dollars is only $200 dollars like the example above.
The other point is that the average lot for indices is lower than the standard forex lot, while the forex lot requires a margin of $1,000 dollars, a standard lot for the above trade require only € 85(about $ 90), this means the standard lot in Stock Indices is 10 times smaller than that one in Forex - Therefore the lot used in the above trade is the equivalent of a forex mini lot.
The screenshot below shows out index trading chart after we have closed our trade & taken our profits.
The System Specifications
Indicators
- 5 and 7 LWMA - Moving Average Crossover Method
- RSI - 50 Center Line Crossover Method
Trading Rules
- Wait For Pullback
- After Pullback, look for entry signal - Both MAs Moving Averages should be moving upward & RSI should be above 50 center mark.
Remember the long term trend for this stock index is upward, therefore we only open buy trades (The Trend is Your Friend).


