RSI Forex Strategies
- RSI Overbought and Oversold Levels
- Relative Strength Index Divergence Setups
- RSI Classic Bullish & Bearish Divergence
- RSI Hidden Bullish & Bearish Divergence
- Swing Failure Strategy
- RSI Chart Patterns Trend Lines
- RSI Summary
Relative Strength Index Indicator Strategy
Relative Strength Index or RSI is one of the most popular forex indicator used in Forex trading. It is an oscillator forex indicator which oscillates between 0 -100. This a trend following forex indicator. It indicates the strength of the forex trend, values above 50 indicate a bullish forex trend while values below 50 indicate bearish Forex trend.
RSI Indicator Measures Momentum of a Forex Trend.
The center-line for the RSI is 50 forex indicator, crossover of the center-line indicate shifts from bullish to bearish forex trend and vice versa.
Above 50, the buyers have greater momentum than the sellers and price on the forex chart will keep going up as long as this RSI indicator stays above 50.
Below 50, the sellers have greater momentum than the buyers and price on the forex chart will keep going downwards as long as RSI indicator stays below 50.
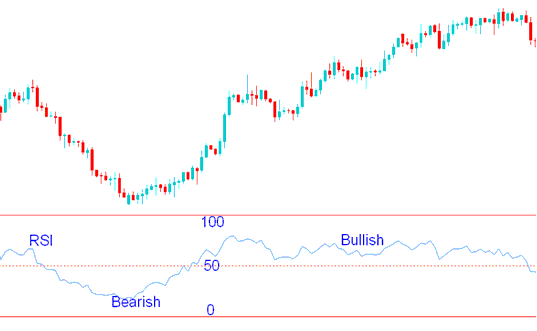
RSI Indicator - How to Trade Forex with RSI Indicator
In the forex trading example above, when the forex indicator is below 50, the price kept moving in a downward forex market trend. The price continues to move down as long as RSI indicator was below 50. When the RSI indicator moved above 50 it showed that the momentum had changed from sell to buy and that the downward forex trend had ended.
When the RSI indicator moved to above 50 the price started to move upwards and the forex trend changed from bearish to bullish. The forex chart price continued to move upwards and the RSI indicator remained above 50 afterwards.
From the forex trading example above, when the forex trend was bullish sometimes the RSI would turn downwards but it would not go below 50, this shows that these temporary moves are just retracements because during all these time the forex price trend was generally upwards. As long as RSI indicator does not move to below 50 the current forex trend remains intact. This is the reason the 50 center line mark is used to demarcate the signal between bullish and bearish forex signals.
The RSI technical indicator uses 14 day period as default period, this is the period recommended by J Welles Wilders when he introduced it. Other oftenly used periods used by traders are the 9 and 25 day moving average.
The RSI technical indicator period used depends on the forex chart time frame you are using to trade, if you are using day forex chart time frame the 14 period will represent 14 days, while if you use 1 hour forex chart time frame the 14 period will represent 14 hours. For our forex example we shall use 14 day moving average, but for your trading you can substitute the day period with the chart time frame you are forex trading with.
To Calculate RSI Indicator:
- The number of days that a forex market is up is compared to the number of days that the forex market is down in a given time period.
- The numerator in the basic formula is an average of all the forex trading sessions that finished with an upward price change.
- The denominator is an average of all the down forex sessions closes for that period.
- The average for the down days are calculated as absolute numbers.
- The Initial RSI is then turned into an oscillator.
Sometimes very large up or down movement in price in a single forex session price period may skew the calculation of the RSI average and produce a false forex signal - whipsaw signal - in the form of a spike.
RSI Center-line: The center-line for this forex indicator is 50. A value above 50 implies that the forex market trend is in a bullish phase as average gains are greater than average losses. Values below 50 indicate a bearish phase in the forex market prices are generally closing lower than where they opened.
Overbought and Oversold Levels: Wilder set the RSI overbought and oversold levels at which the forex market moves are overextended at 70 and 30.


