RSI Divergence Setups - Identifying Bullish and Bearish Divergence RSI
FX Divergence is a trade setup used by traders. It means looking at both a chart and another indicator. We'll use the RSI indicator as our example.
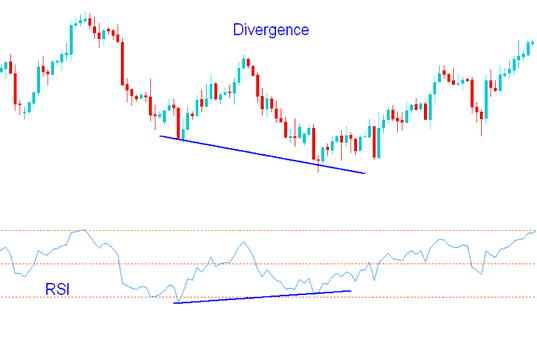
To identify divergence setups, locate two chart points where the price forms a new swing high or swing low, but the RSI does not follow suit. This disparity between price and momentum indicates a divergence.
RSI Forex Divergence Example:
In the chart below we identify 2 points, point A and point B (swing highs)
Then, using RSI, we look at the highs created by the RSI indicator: these highs are right below the points labeled A and B on the chart.
We then draw one line on the trading chart & another line on the RSI.

RSI Divergence Trading Setup: Executing Forex Divergence Trades using RSI, encompassing both Bullish RSI Divergence and Bearish RSI Divergence.
How to identify divergence setup
To identify this divergence trading setup, we need to look for the following signs:
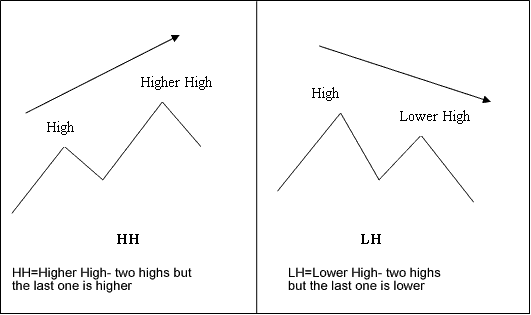
HH = Higher High - two highs but the last one is higher
LH = Lower High - 2 highs but the last one is lower
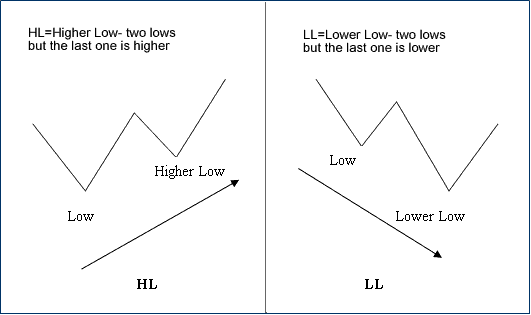
HL = Higher Low - 2 lows but the last one is higher
LL = Lower Low - two lows but the last one is lower
First let us look at the explanations of these trading terms

Divergence Terms - RSI Bullish Divergence vs RSI Bearish Divergence

FX Divergence Terms Definition Examples - Bullish Divergence and Bearish Divergence RSI
There are 2 types of divergence setups:
- Classic Forex Divergence
- Hidden Divergence Setup
Learn More Topics & Guides:
- Two Different Trading Methods That People Often Use
- HSI 50 Trading System
- Indicators for the S&PASX 200 Available on MetaTrader 4
- Setting Up Ehlers Laguerre RSI Expert Advisors for Forex Trades
- Adding DAX to MT5 DAX Application
- What are Ultimate Oscillator Buy and Sell Signals?
- Choosing an Online Broker for Trading the CAC 40 Index
- Optimal Times to Trade USDSGD in GMT
- Building Technical Analysis Knowledge for Forex Trades
- USD SEK Trading Spreads

