RSI Swing Failure Trade Setup
RSI swing failures spot short-term shifts accurately. They work for long trends too, but suit reversal trades best.
The RSI swing failure setup is a signal that the market's about to reverse. It's a heads-up that a support or resistance level is about to get broken. You want to see this setup above 70 for an uptrend, or below 30 if things are headed down.
Swing Failure In an Upwards Trend
If the RSI touches 79, pulls back to 72, rises again to 76, and finally drops below 72, it forms a failure swing setup. Since the 72 level serves as RSI support and has been breached, it suggests that price levels are also likely to follow suit and breach their support.
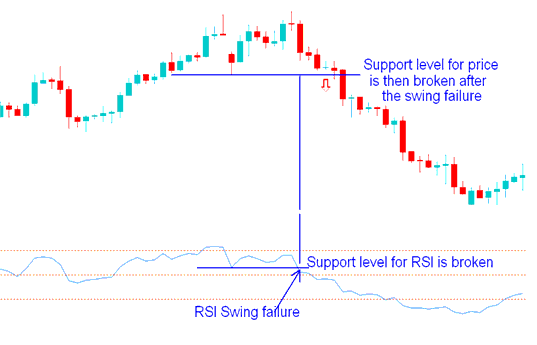
In the example shown below, the RSI hits 73 and then goes back down to 56, which is a support level. The indicator then goes up to 68 before dropping below 56, breaking the support level. After that, the price also breaks its support level. The RSI swing failure gives an early signal, and it's confirmed when the price breaks its support area too. Some traders will trade right after the swing failure, while others wait for the price to confirm it, letting each trader pick what works best for them.

RSI Swing Failure in an Upwards Trend
Swing Failure Setup In a Downwards Trend
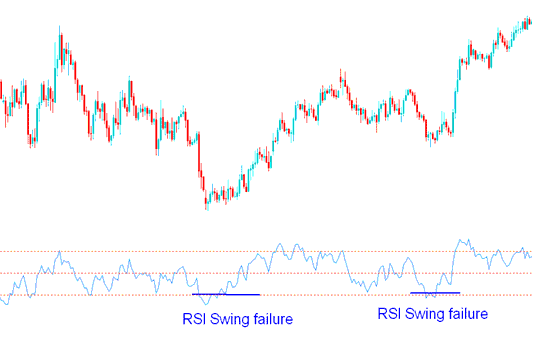
A failure swing setup is considered to occur when the RSI first reaches 20, then rebounds to 28, then drops to 24 before breaking through 28. Given that the 28 level is an RSI resistance level and has been broken through, price will follow, and it will break through its resistance area.

RSI Swing Failure in a Downward Trend
Explore Further Training & Subject Areas:
- Calculating the Value of 1 Pip for IBEX35 Index
- Doji Candlesticks and Marubozu Candles Pattern
- How to Set US 100 in MT5 Android App
- What's EUR AUD Pip Value?
- How Do You Place XAU USD Chart on MT4 Software/Platform?
- MT4 Indicator Stochastic MT4 Trading Indicator
- Technical Indicator MACD Center Line Crossover: Generating Forex Bullish Signals & Forex Bearish Signals

