How to Trade Support & Resistance Gold Chart Levels using Support and Resistance Indicator
XAUUSD Trade Support & Resistance Zones using XAUUSD Support and Resistance Indicator
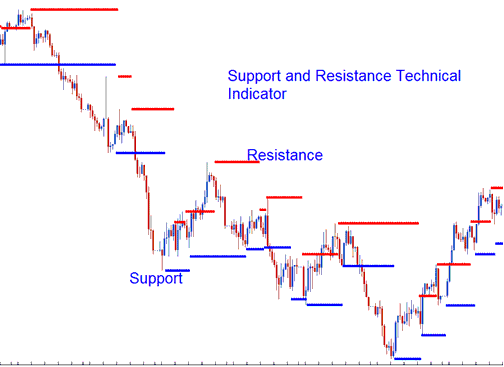
Support & Resistance Gold Indicator is used by traders to draw xauusd support levels & xauusd resistance levels on xauusd charts automatically. The Support & Resistance Indicator can be placed on a xauusd chart & this Support & Resistance XAUUSD Indicator will then draw the Support & Resistance Levels on the gold chart.
The support & resistance levels will be marked using red line & blue line buy the Support & Resistance XAUUSD Indicator.
XAUUSD Trade Support & Resistance Zones using XAUUSD Support and Resistance Indicator?
Gold Technical Analysis of Support & Resistance Levels
When it comes to support & resistance levels gold price can either bounce off these support & resistance areas or break through these support & resistance areas.
Support areas indicate the level where the majority of xauusd trading believe that prices will move higher
If a support area is broken - price will move lower & the support level will turn to a resistance level.
Resistance levels indicate the price at which a majority of xauusd traders feel gold price will move lower
If a resistance level is broken -price will move higher & the resistance level will turn to a support level.
Once gold price has broken through a support level or a resistance level then it's likely that the gold price will continue heading in that particular direction until it gets to the next support or resistance level.
The more often a support level or resistance area is tested by the gold price & bounces off, the more major that particular support or resistance level becomes.
XAUUSD Trade Support & Resistance Gold Chart Levels using Support and Resistance Technical Indicator


