How Do I Interpret Reverse Head and Shoulders Chart Pattern Technical Analysis?
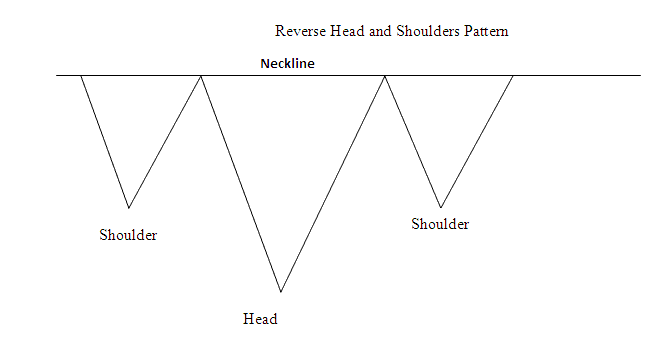
A Reverse Head & Shoulders pattern is a bullish trend reversal trading signal which trading signals the current downwards gold price trend is about to reverse once the Reverse Head & Shoulders chart pattern is confirmed.
The Reverse Head & Shoulders pattern is a pattern with three consecutive lows where the second low is slightly lower than the first and third low which signals the downward xauusd trend is losing momentum & if gold price of the xauusd rises above the resistance level which is the 2 highs between the three lows then the Reverse Head & Shoulders pattern is considered confirmed & the gold price of the xauusd changes to a bullish trend.
How Do You Interpret Reverse Head and Shoulders Pattern Technical Analysis?


