Balance of Power XAUUSD Technical Analysis & Balance of Power XAUUSD Signals
Developed by Igor Livshin
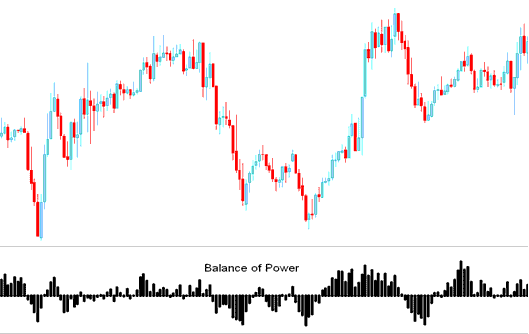
Balance of Power indicator measures the strength of the bulls versus the bears by assessing ability of each to push gold price to extreme levels.
XAUUSD Technical Analysis and How to Generate Trading Signals
When using this technical indicator, the zero line crossovers are used to generate trading signals.
Center is marked as the zero line, areas oscillating above or below are used to generate trading signals.
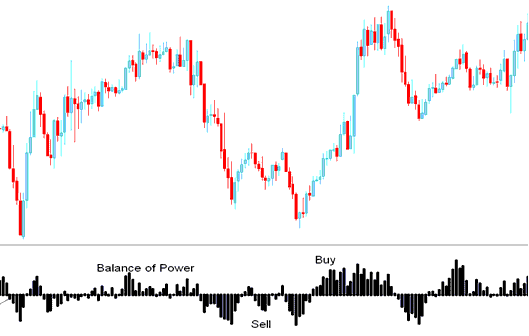
Buy - The scale is marked from Zero to +100 for bullish market movements
Sell - The scale is marked from Zero to -100 for bearish market movements
How to Generate Buy and Sell XAUUSD Signals
Buy Signal
When BOP crosses above zero a buy signal is given.
Also when the BOP is rising, the xauusd market is in an upward trend, some traders use this as a buy signal but it's best to wait for the confirmation by moving above the zero mark. As this will be a buy signal in a bearish territory and this type of trading signal is more likely to be a xauusd whipsaw.
Sell Signal
When BOP crosses below zero a sell signal is given.
Also when the BOP is declining, the xauusd market is in a downward trend, some traders use this as a sell signal but it is best to wait for a confirmation by moving below the zero mark because this will be a sell signal in bullish territory & this type of trading signal is more likely to be a xauusd whipsaw.
Sell & Buy XAUUSD Signals
Divergence XAUUSD
In xauusd trading, divergences between the BOP and gold price can be used to effectively spotting potential reversal and/or trend continuation points in the gold price movement. There are several types of divergences:
Classic Divergence - XAUUSD Trend reversal xauusd signal
Hidden Divergence - XAUUSD Trend continuation
Gold Overbought/Oversold Conditions
This Balance of Power can be used to identify potentially overbought and over-sold conditions in gold price movement.
- Overbought-Oversold levels can be used to provide an early signal for potential xauusd trend reversals.
- These levels are generated when indicator clusters its tops & bottoms thus setting up the overbought & oversold levels around those values.
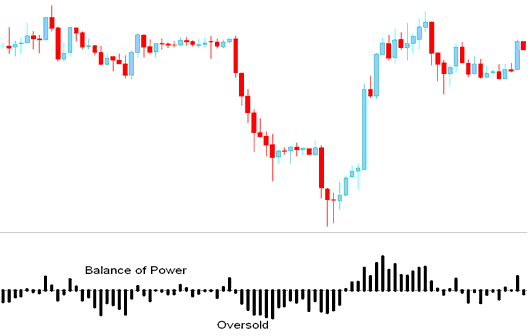
However, gold price might also stay at these over bought & oversold levels & continue moving in that direction for a while & thus it is always good to wait until the BOP crosses over Zero mark.
From the xauusd example shown below, even though the Balance of Power showed the gold price was oversold, price continued moving downwards until the technical indicator crossed over to above Zero.
Technical Analysis in XAUUSD Trading


