Parabolic SAR Technical Analysis and Parabolic SAR Signals
Created by J. Welles Wilder.
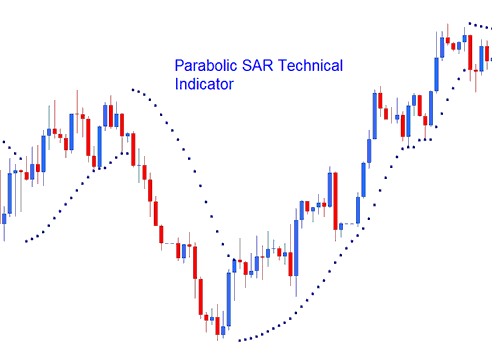
The Parabolic SAR is a technical indicator widely used to set trailing price stop-loss orders. Commonly referred to as SAR (Stop-And-Reversal), this tool closely follows price action.
- In an Uptrend, the stop & reversal will trail below market price
- In a downtrend, the stop & reversal will trail above market price

Technical Analysis and How to Generate Trading Signals
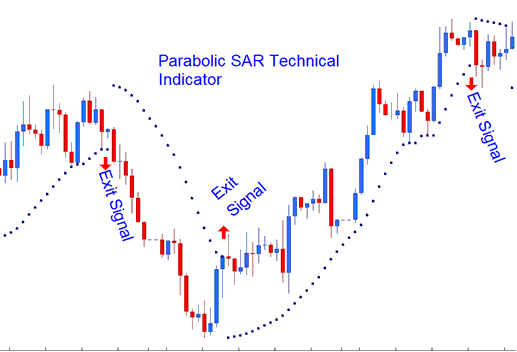
This trading signal offers fantastic exit locations.
Exit Trade Signal for Buy trade positions
Traders must exit long positions once the price dips under the key technical indicator.
If you're trading long, meaning the price is higher than the stop and reversal, the SAR will go up every day, no matter which way the price is moving. How much the indicator moves depends on how many pips the market prices move. When the SAR changes direction, the market trend also changes to go down. This tells you to sell your long trades.
Exit Signal for Sell trade transactions
Traders should close short positions when price rises above the indicator.
For short positions, when the price is below the stop and reversal, the SAR will continue to decline daily, regardless of price action. The indicator's movement correlates with market price shifts. When the SAR reverses direction, it signals a change in market trend, indicating an exit point for short trades.

Exit Trade Signal for Buy & Sell trade transactions
Check Out More Lessons, Tutorials, and Topics

