
Chart Patterns Trading Gold Setups
Chart patterns show repeating price action setups that traders often use to analyze the online gold market.
Chart patterns are used in technical analysis, assisting Gold traders in learning how to spot these chart setups that happen again and again.
These chart patterns matter in Gold trading because when the market isn't clearly going one way, it makes a pattern. Knowing these shapes helps you guess what might happen next with the Gold price.
When gold price changes are shown on a chart, different shapes and patterns appear naturally and happen repeatedly. Many traders who use technical analysis use these patterns to guess and predict what the market will likely do next.
Traders often analyze patterns and formations to understand the supply and demand dynamics that drive XAUUSD Gold price fluctuations, which are categorized into three distinct types.
Examples of reversal chart patterns include double tops, double bottoms, head-and-shoulders, and inverted head-and-shoulders formations.
2. Chart patterns that continue trends: Ascending triangle and Descending triangle - Bull pennant/flag and Bear pennant/flag formations.
3. Symmetrical Triangle (Bilateral Pattern) - Indicating Consolidation: Rectangle - Signifying Ranging Market
Reversal patterns signal a trend change once confirmed. They form after a long up or down move. This shows the market will shift direction.
Continuation patterns on charts are those formations that prepare the market for a movement in the same direction as the previous trend. These patterns emerge when the market pauses temporarily before resuming the prior trend in the XAUUSD gold prices.
Consolidation formations - these market pauses occur as the trading environment takes a breather before establishing the subsequent trend direction. The appearance of these chart configurations indicates the market is attempting to resolve its forthcoming trading pathway.
Analysis of Charts
Trading encompasses two primary modalities of chart examination, which, despite superficial similarities, operate on different principles:
Japanese Candlestick Patterns - Look at one candle. Learn Japanese Candlesticks - Check groups of candlestick shapes.
(This tutorial is about the second option above - patterns)
The different topics for these two types of chart analysis are:
Japanese Candles Patterns
- Marubozu and Doji Candles Patterns
- Spinning Tops Candlesticks Patterns
- Reversal Candlesticks Patterns
- Inverted Hammer and Shooting Star Candlesticks Patterns
- Piercing Line and Dark Cloud Candles Patterns
- Morning Star and Evening Star Candlesticks Patterns
Chart Patterns Guides
- Double Tops and Double Bottoms Setups
- Continuation Patterns
- Consolidation Setups
- Head Shoulders & Reverse/Inverse Head & Shoulders Setups
The pictures below show how these two technical analysis methods differ in setup.
Candle Patterns - Examining a single candle's behavior
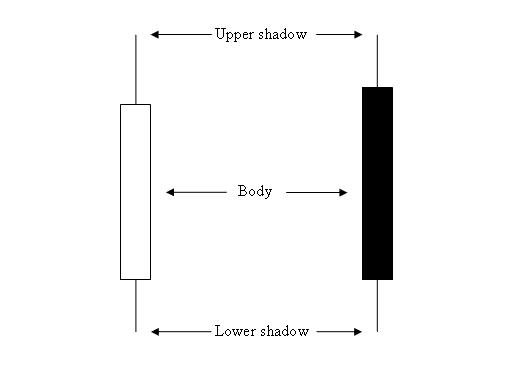
Candles Pattern
Chart Patterns - An examination of a series of candlestick formations.
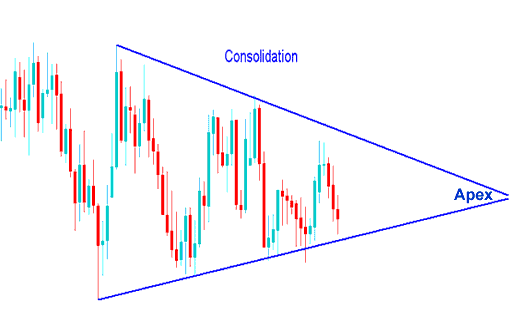
Consolidation Pattern - Trading XAUUSD Using Patterns
Explore Additional Lessons & Guides:
- Guide to Trade IT40 Indices
- Chaikin's Money Flow Indicator Application on MT4 Chart Tools
- Opening and Closing Hours for EURSEK
- Steps to Place a Custom Indicator on the MetaTrader 5 Platform
- FX Trading Platform Navigation: Utilizing the Periodicity Tool Bar Menu in MetaTrader 4
- Keltner Bands FX Trade Buy and Sell Trade Ideas
- Chandes Trendscore MT5 Technical Analysis in FX
- Index Trading Strategy Strategy