MACD Strategy
- MACD Fast Line Versus Signal Line
- Trading Signals for Buying and Selling with MACD
- MACD Signals for False Breakouts
- How to Spot Center Line Crossover Signals
- Exploring Classic Bullish & Bearish Divergence Via MACD
- How to Spot Hidden Bullish and Bearish Divergence with MACD
- Summary of MACD Indicator
MACD Center Line Cross over
The MACD indicator stands out as one of the most common tools in cryptocurrency trading. It acts as a momentum oscillator. It also shows some bitcoin trend-following traits.
MACD ranks as a top indicator for crypto technical analysis. It creates signals through crossovers in cryptocurrencies.
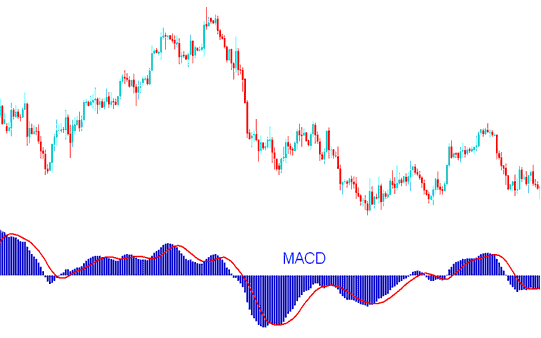
The MACD illustrates the coming together and pulling apart of moving averages. This technical indicator is mathematically derived from the analysis of moving averages. Moving Average Convergence/Divergence functions as a trend-following indicator for cryptocurrency markets, revealing the interconnectedness between two distinct moving averages.
One moving average (MA) is based on a shorter period, while the other is based on a longer period of Bitcoin price bars.

MACD Indicator - MACD Technical Indicator Analysis
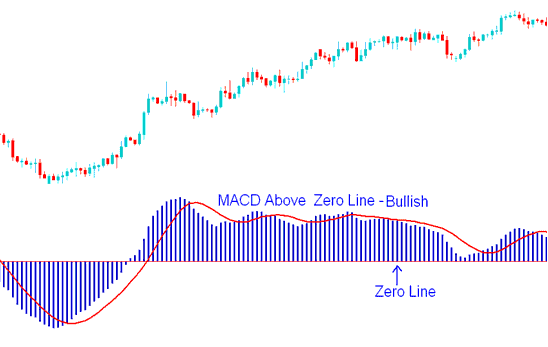
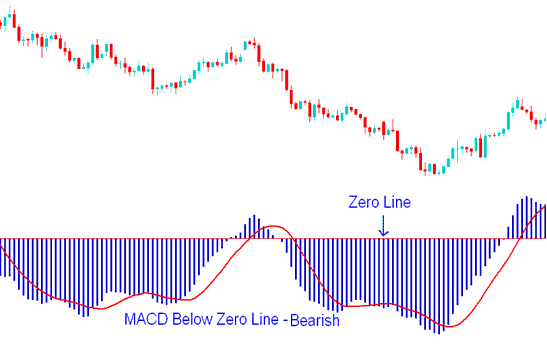
The MACD crypto indicator centers on zero. Readings above zero signal bullish moves, below bearish.
When Bitcoin is trending up, the shorter MACD line goes up faster than the longer MACD line, creating a gap. Also, if the MACD indicator is above the middle line, the bitcoin trend is still going up, as shown below.
Avoid selling as long as the MACD Bitcoin Indicator remains positioned above the Center Line Mark: this configuration signifies bullish territory, and its instructional significance remains regardless of the indicator's precise movement above the zero center line, as illustrated in the subsequent crypto example.

MACD Indicator Above Zero Mark - Bullish Signal
In a bitcoin trend where prices are going down, the shorter MACD line drops faster than the longer MACD line, making a space between them. Also, if the indicator is below the middle line, the bitcoin trend is still going down, as shown below.
Don't buy if the MACD Bitcoin Indicator is below the Center Line Mark, because this area means the market is going down. It doesn't matter how it's moving as long as it's below the zero center line mark, like what is shown on the cryptocurrency example below.

MACD Bitcoin Indicator Below Zero Center Line Mark - Bearish Signal
When the bitcoin trend is about to turn and reverse the MACD lines begin to move closer to each other, thus closing the gap.
More Tutorials and Courses:
- Identifying Support and Resistance Levels in Bitcoin Charts (BTC/USD)
- Leading Websites for Bitcoin Trading
- Guide for Downloading the MT4 Bitcoin Trading Software for Windows PCs
- Steps to Opening a Real BTCUSD Account on MetaTrader 4
- Bollinger Band BTC USD Technical Indicator Analysis on Bitcoin
- BTCUSD MT5 Trade Platform Market-Watch Window for MetaTrader 5 BTC USD Software Symbols List
- What is BTCUSD Chart and How to Read BTC USD Charts?
- How to Calculate BTCUSD Margin Formula
- Using Take Profit and Stop Loss Orders in Trading Software
- Trading Bitcoin Effectively on the MetaTrader 4 iPad App
