Bollinger Band Analysis & Bollinger Trading Signals
Created by John Bollinger
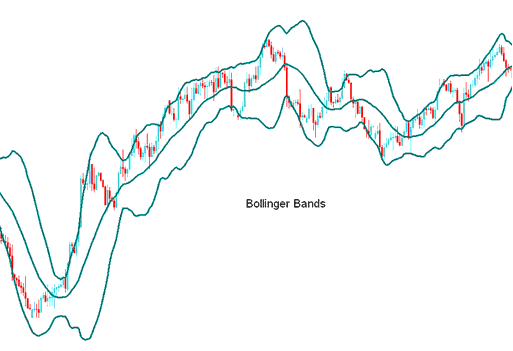
The Bollinger Band structure consists of three distinct lines: the central line represents a 20-period Simple Moving Average.
The lines are then made at a certain distance from the average movement. These lines are what create the top and bottom boundaries.
Bands sit at spots set by standard deviation. This tool measures ups and downs in the bitcoin or BTCUSD market.
BTCUSD market volatility is always changing, so standard deviations shift too. Since Bollinger Bands use standard deviation to set their distance, the bands constantly adjust to match current BTCUSD conditions.
When the btcusd markets become more volatile, the bands widen & they contract during less volatile periods.
The 3 Bands are made to include most of the bitcoin price changes. The middle band is the basis for the market's direction, and it is usually a simple moving average over 20 periods.
This middle band acts as the base for the upper and lower bands. Their distance from the middle depends on market volatility. The upper band sits two standard deviations above the middle Bollinger band. The lower one lies two standard deviations below it.

BTCUSD Analysis & Generating Signals
- Bands provide a relative meaning of high & low
- Used to identify periods of high & low volatility
- Used to identify periods when bitcoin prices are at the extreme regions
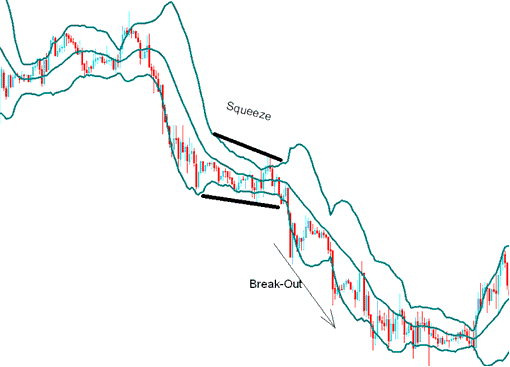
the Squeeze
The Bollinger bands tighten as market volatility reduces, this identifies periods of consolidation. Sharp bitcoin price breakouts tend to occur and happen after the bands tighten.

Pattern of Consolidation
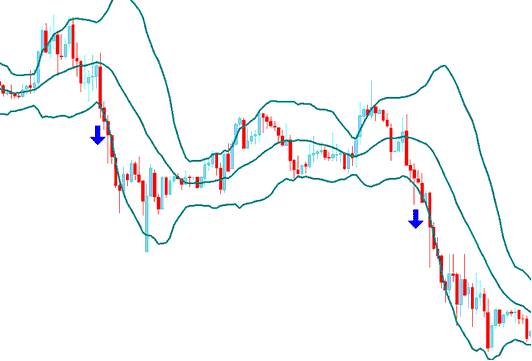
the Bulge
Bitcoin price breaks band edges. Expect the trend to keep going.

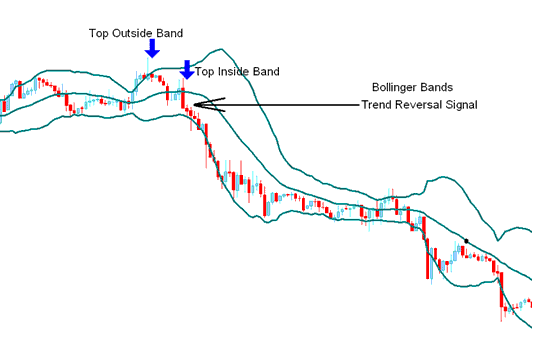
Reversal Signals
When the price goes beyond the bands and then comes back inside, it often means the market trend is changing direction.

The Head Fake - Bitcoin Whipsaw
Traders should remain vigilant for false breakouts, commonly referred to as whipsaws or head fakes.
Bitcoin Price often quickly breaks out in one direction after the Squeeze setup, leading many traders to believe the breakout will continue, but it quickly reverses and makes the real, more important breakout in the other direction.
Traders who act immediately on an initial breakout frequently find themselves misaligned with the actual direction of Bitcoin's price movement. On the other hand, those ready for a potential 'false breakout' can quickly exit their initial position and re-enter a trade that aligns with the ensuing reversal. To verify such scenarios, combining Bollinger Bands with additional technical indicators is highly recommended.
Obtain Further Instruction Sets and Programs:
- Is Bollinger Band Fib Ratios Technical Indicator a Leading or Lagging Indicator?
- Equity Management: Techniques and Instruments for Managing Trade Funds
- Stop Loss BTC USD Order Calculator Download
- What You Need to Know to Start BTC USD Trade?
- How Do You Place a Sell Stop Order on MetaTrader 5 Online Platform Software?
- What Crypto Trade Instruments are the Best to Trade With?
- Inverted Hammer Candle Pattern and Shooting Star Candle Pattern
- How Do I Analyze Chart BTC USD Price Patterns in BTC USD Analysis?
- Trading Indicators for Setting Bitcoin Trade SL Orders
