How Do I Interpret Fibonacci Retracement Levels Bitcoin Trading Analysis?
Bitcoin Trade Fibonacci Retracement Levels Bitcoin Trading Analysis
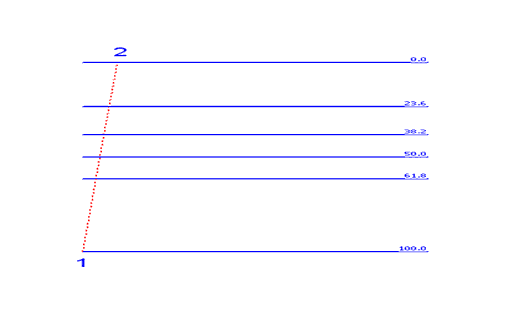
The Fibonacci retracement levels are explained below: traders should use this Fibonacci Retracement Levels bitcoin indicator to determine where to open a bitcoin trade whether a buy bitcoin trade in a cryptocurrency upward trend and a sell bitcoin trade in a downward cryptocurrency trend.
How Do I Use Fibonacci Retracement Levels for Day Trading?
How Do I Use Fibonacci Retracement Levels for Day Trading?
How Do I Use Fibonacci Retracement Levels for Day Trading? - Fibonacci Retracement Tool Described
How Do I Use Fibonacci Retracement Levels for Day Trading? - Fibonacci Retracement Tool Described
Bitcoin Upward Trend Strategy
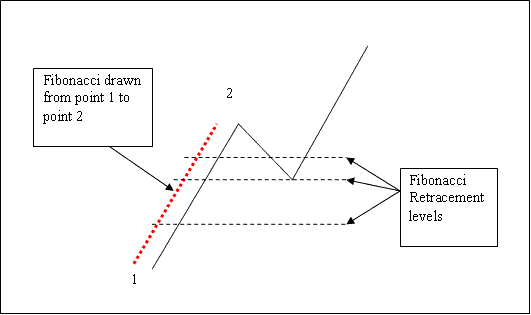
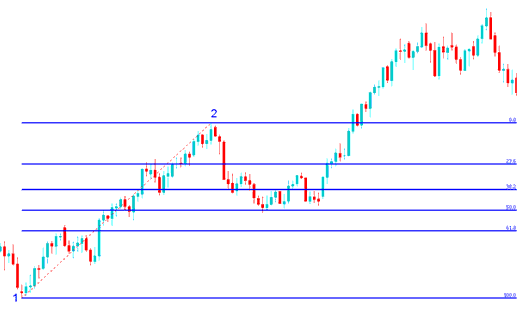
In the technical analysis cryptocurrency trading example illustrated below the bitcoin price is moving up between cryptocurrency chart point 1 & cryptocurrency chart point 2 then after cryptocurrency chart point 2 it retraces down to 50.0% Fibonacci retracement level then bitcoin price continues moving up in the original upward cryptocurrency trend. Note that this bitcoin price retracement bitcoin indicator is drawn from point 1 to point 2 in direction of the Bitcoin trend (Upwards Direction).
Bitcoin Analysis of How Do I Use Fibo Retracement in an Upward Bitcoin Trend?
Technical Analysis of How Do I Use Fibonacci Retracement in an Up Bitcoin Trend?
Once the bitcoin price hit the 50.0% Fibonacci retracement level, this Fibonacci retracement level provided a lot of support for the bitcoin price, and afterward bitcoin market then resumed the original upwards bitcoin trend & continued to move up.
For this technical analysis bitcoin trading example, the bitcoin price retracement reached the 50.0% Fibonacci retracement level, but most of the time the btcusd trading market will retrace up to 38.2% Fib retracement level and therefore most of the time bitcoin traders set their buy limit bitcoin orders at the 38.2% Fibonacci retracement level, while at the same time placing a stop just below 61.8% Fibonacci retracement level.
Bitcoin Downwards Trend Strategy
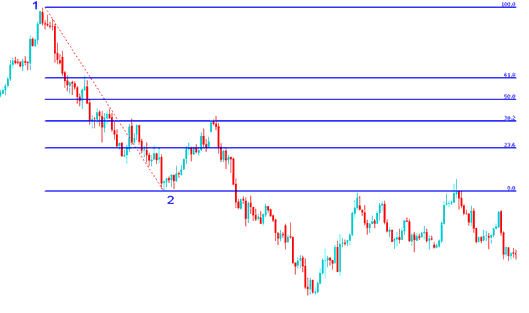
In the Bitcoin Retracement Strategy cryptocurrency trading example illustrated below the bitcoin market is moving down between cryptocurrency chart point 1 & cryptocurrency chart point 2, then after cryptocurrency chart point 2 the bitcoin price then retraces up to 38.2% Fibonacci retracement level then it continues moving downward in the original downward cryptocurrency trend. Note that this bitcoin price retracement bitcoin indicator is drawn from bitcoin chart point 1 to bitcoin chart point 2 in the direction of the Bitcoin trend (Downwards Direction).
Bitcoin Analysis of How Do I Use Fibonacci Retracement in a Downward Bitcoin Trend?
Technical Analysis of How Do I Use Fibonacci Retracement in a Downwards Bitcoin Trend?
The above technical analysis cryptocurrency trading example is a bitcoin price retracement trading setup where the bitcoin price retraces immediately after touching the 38.20% Cryptocurrency Chart Fibo Retracement Level.
In this technical analysis cryptocurrency trading example the bitcoin price retracement of bitcoin price reached 38.20% Fibo retracement level & did not get to 50.00% Fibo retracement level. It is always good to use 38.2% Fibo retracement level because most times the bitcoin price retracement doesn't always get to 50.00% Fibo retracement level.
This Bitcoin Retracement level provided a lot of resistance for the bitcoin price retracement, this was the best place for a trader to set a sell limit bitcoin order as the btcusd trading market quickly moved down after hitting this Fibonacci retracement level.
How Do I Read Fibonacci Retracement Levels Bitcoin Trading Analysis


