Bollinger Band BTCUSD Methods
- Understanding Bollinger Bands
- Analysis of Volatility using Bollinger Bands
- Understanding Bollinger Band's Expansion (Bulge) and Contraction (Squeeze)
- Bollinger Band Bitcoin Price Action in Trends
- Looking at Bitcoin Price Action Using Bollinger Bands
- Utilizing Bollinger Bands to Identify Bitcoin Trend Shifts
- Overview of Bitcoin Strategies Using Bollinger Bands
Bollinger Band Bitcoin Indicator Strategy
The Bollinger Band measures volatility in crypto. It overlays on bitcoin price charts.
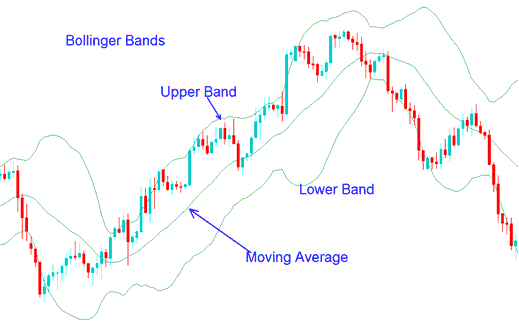
The Bollinger Bands tool has three lines: a middle moving average, plus upper and lower bands. They surround bitcoin prices, and action stays inside them.
Bollinger Bands cryptocurrency indicator forms upper & lower bands around a moving average MA. Default moving average for bollinger bands technical technical indicator is the 20-SMA. Bollinger Bands cryptocurrency indicator use the concept and formula of standard deviation to form their upper and lower Bands.
The example of Bollinger Band cryptocurrency indicator is shown below.

Bollinger Bands Indicator - A Methodology for Trading Bitcoin utilizing Bollinger Bands
Standard deviation tracks bitcoin price swings, which change often. Bollinger bands adjust width to match. High swings widen bands: low ones shrink them.
Bollinger Bands use Bitcoin price moves to share key details. The info covers a lot of price shifts.
- Periods of low market volatility - consolidation period of the btcusd market.
- Periods of high volatility - extended trends, trending markets.
- Support and resistance levels of the bitcoin price.
- Buy and Sell points of the bitcoin price.
More Lessons and Tutorials & Guides:
- Utilizing Fibonacci Pullback Strategies Based on Fibonacci Pullback Levels for Bitcoin
- Steps to Initiate a Demo Trade Account within the MetaTrader 5 Software
- How Do You Add Trading Design on MetaTrader 5 Software?
- BTCUSD Trading Open Real MetaTrader 5 BTC USD Account
- Electronic Communication Network BTC USD Broker vs STP Broker
- How to Create a One-Page BTCUSD Trading Plan
