Bollinger Band Indicator & Bitcoin Price Volatility
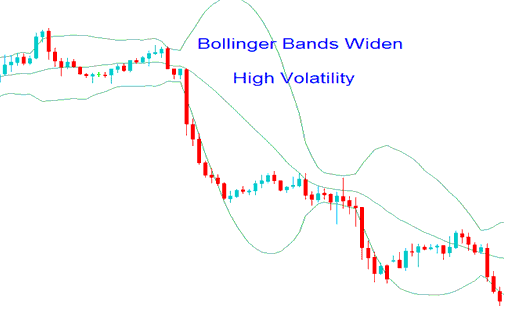
When the volatility of bitcoin prices is elevated: bitcoin prices tend to close significantly distant from the moving average, resulting in an increase in the width of the bitcoin Bollinger Bands to accommodate a greater range of potential bitcoin price movements that may fall within 95% of the mean.
As the volatility of bitcoin prices increases, the Bollinger Bands indicator will expand. This expansion will be visible as the bands bulge around the bitcoin price. When the Bollinger Bands for bitcoin show such widening, it indicates a continuation pattern for btcusd, suggesting that the market will keep moving in that direction. Typically, this serves as a signal for the continuation of bitcoin trends.
The Bollinger bands indicator exemplification illustrated below illustrates the Bollinger bulge.

High Volatility Observed in Bitcoin - Analysis Using the Bollinger Band Indicator - Identifying the Bollinger Band Bulge Phenomenon
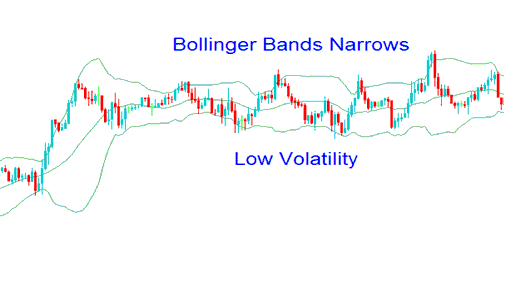
Low bitcoin volatility brings prices near the moving average. The bands narrow. This limits moves within 95% of the average.
Low bitcoin volatility leads to consolidation before a breakout. When Bollinger Bands move flat, stay out of trades. Avoid opening any crypto positions then.
The illustration of the Bollinger Bands indicator is provided below, showcasing the contraction of the Bitcoin Bands.

Low Bitcoin Price Volatility - Bitcoin Bollinger Bands Indicator - Understanding the Bollinger Bands Squeeze.
Learn More Tutorials:
- How Can You Analyze/Interpret Fibo Extension Settings on MetaTrader 4 BTCUSD Charts?
- Top Ten Strategies for BTC/USD Market Success
- Techniques for Capitalizing on a BTC/USD Price Breakout Pattern
- Learn How Can You Analyze MetaTrader 5 BTC/USD Trading Charts?
- How Do Draw Fibonacci Pullback in MT4 Software Platform?
- How to Download a BTCUSD Trading App on iPad
- Trading Tutorials and Course Guide
- Description of Bitcoin Price Action Continuation Patterns Observed on BTCUSD Charts
- Strategy Using a 4-Hour Time Frame for BTC/USD
