Bollinger Bands Bitcoin Trend Reversals
A trader should wait for the bitcoin price to turn in the opposite direction after touching one of the bitcoin trading Bollinger bands before considering that a bitcoin trading reversal is happening.
Even better a trader should see the bitcoin price cross over the moving average.
Double Bottom Bitcoin Trend Reversals
A double bottoms is a buy cryptocurrency signal setup. Double top occurs when bitcoin price action penetrates the lower Bollinger band then rebounds forming the first bitcoin price low, then after a while another bitcoin price low is formed, & this time it's above the lower Bollinger band.
The second bitcoin price low must not be lower than the first one and it important is that the second bitcoin price low does not touch or penetrate the lower Bollinger band. This bullish cryptocurrency trading setup is confirmed when the bitcoin price action moves and closes above the middle band (simple moving average).
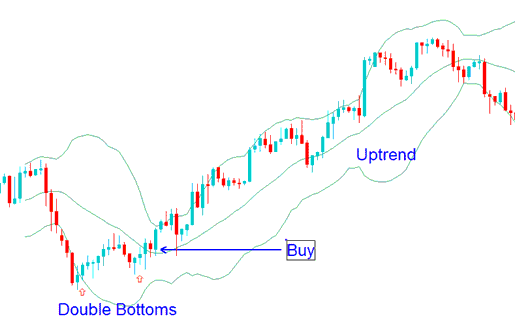
Double Bottom - Bollinger Bands Bitcoin Trend Reversals Trading Strategy Using Double Bottoms Bitcoin Chart Patterns
Double Top Bitcoin Trend Reversals
A double top is a sell cryptocurrency signal setup. Double top occurs when bitcoin price action penetrates the upper Bollinger band then rebounds down forming the first bitcoin price high., then after a while another bitcoin price high is formed, & this time it's below the upper Bollinger band.
The second bitcoin price high must not be higher than the first one and it important is that the second bitcoin price high does not touch or penetrate the upper Bollinger band. This bearish cryptocurrency trading setup is confirmed when the bitcoin price action moves and closes below the middle band (simple moving average).
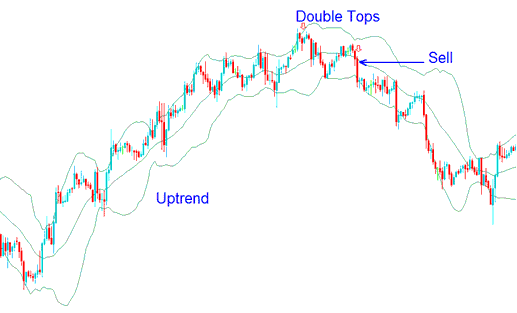
Double Top - Bollinger Bands Crypto Trend Reversals Trading Strategy Using Double Tops Crypto Chart Patterns