RSI Strategy
- Identifying RSI Overbought and Oversold Regions
- Setups for Trading RSI Divergence
- Spotting RSI Bullish and Bearish Classic Divergence Patterns
- Identifying Hidden Bullish & Bearish Divergence in RSI
- Methods for Swing Failures
- RSI Crypto Patterns Bitcoin Trendlines
- RSI Summary Overview
RSI Strategy
RSI, or Relative Strength Index, stands out as a favored tool for those who trade bitcoin. It is an oscillator trading indicator with values that range from 0 to 100. It's a tool that follows the direction of bitcoin trends. It shows how strong the btcusd crypto trend is, with values over 50 suggesting the bitcoin trend is going up, and values under 50 suggesting the Bitcoin trend is going down.
RSI Bitcoin Indicator Measures Momentum of a Bitcoin Trend.
RSI centerline sits at 50 for crypto. Crossing it signals a switch from bull to bear bitcoin trend, or back.
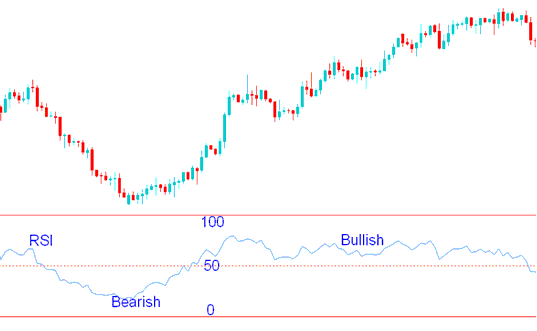
When the RSI indicator is above 50, it indicates that buyers have a stronger momentum compared to sellers, leading to an upward trend in bitcoin price on the chart as long as the RSI remains above this level.
Below 50 on the RSI, sellers outpace buyers. Bitcoin prices drop as long as the indicator stays under 50.

RSI Indicator for Cryptocurrencies - Strategies for Trading Bitcoin Utilizing the Relative Strength Index Technical Indicator
In the example of trading shown above, the price of bitcoin kept going down when the indicator was under 50. The bitcoin price kept falling while the RSI stayed below 50. When the RSI cryptocurrency indicator went above 50, it meant that the power had changed from selling to buying, and the bitcoin trend going down had stopped.
When the bitcoin price started its upward movement, coinciding with the RSI cryptocurrency indicator crossing above 50, the bitcoin trend shifted from bearish to bullish. The bitcoin chart price subsequently continued its ascent, with the RSI maintaining a position above 50.
In the trading example shown above, when bitcoin was going up, sometimes the RSI would go down but not below 50. This means these short-term changes are just pullbacks, because the price of bitcoin was mostly going up during this time. If the RSI does not go below 50, the current bitcoin trend is still in place. That is why the 50 mark in the middle is used to show the difference between bitcoin signals that are going up and those that are going down.
The standard configuration for the RSI cryptocurrency technical gauge utilizes a 14-day window, which aligns with the initial recommendation provided by J Welles Wilder upon its introduction. Bitcoin traders frequently employ alternative periods such as 9 or 25 days.
The selection for the RSI period is contingent upon the specific crypto chart timeframe being used for trading. For instance, if utilizing a daily timeframe, a setting of 14 periods corresponds to 14 days, whereas on an H1 crypto chart, the 14-period setting reflects 14 hours. For instructional purposes here, we will default to a 14-day moving average, but for personalized trading, you are encouraged to substitute the fixed period with the timeframe relevant to your current Bitcoin trading activity.
To Calculate RSI Indicator:
- The number of days that a cryptocurrency market is up is compared to the number of days that the btcusd trading market is down in a given period of time.
- The numerator in the basic formula is an average of all the bitcoin trading sessions that finished with an upward bitcoin price change.
- The denominator is an average of all the downward bitcoin trading sessions closes for that period.
- The average for the downwards days is calculated as absolute numbers.
- The Initial RSI is then turned in to an oscillator indicator.
Sometimes very big price increases or decreases in bitcoin during one bitcoin trading session can change the RSI average calculation and cause a wrong signal - a fake-out signal - that looks like a spike.
RSI Centerline: The midpoint for this technical tool is 50. If the value is over 50, it shows that the bitcoin market is doing well since the average gains are greater than the losses. On the other hand, if the value is below 50, it suggests that the market is struggling, as prices are usually lower than where they started.
Overbought & Over-sold Levels: Wilder set the RSI overbought and oversold levels at which the btcusd market heads are overextended at 70 & 30.
Get More Topics:
- Analyzing BTC USD Movement After Ascending Triangle Pattern
- The How to Setup Course for MetaTrader 4 Trading App
- How can you understand/look at and log in and sign in to the MT4 Platform?
- Understanding the Inverted Hammer and Shooting Star Candle Patterns
- BTC USD Pin Bar Trades with Fibonacci Retracement Levels
