RSI Bitcoin Indicator Divergence Bitcoin Trading Setups
Bitcoin Divergence is one of the trade setups used by Bitcoin traders. It involves looking at a cryptocurrency chart and one more cryptocurrency indicator. For our example we shall use the RSI indicator.
To spot this cryptocurrency trading divergence trading setup find two cryptocurrency chart points at which bitcoin price makes a new swing high or a new swing low but the RSI cryptocurrency indicator doesn't, indicating a divergence between bitcoin price & momentum.
RSI Bitcoin Divergence Example:
In the cryptocurrency chart below we spot two cryptocurrency chart points, point A and point B (swing highs)
Then using RSI cryptocurrency technical indicator we check the highs made by the bitcoin trading RSI technical indicator, these are highs that are directly below the bitcoin Chart points A and B.
We then draw one line on the cryptocurrency chart & another line on the RSI indicator.
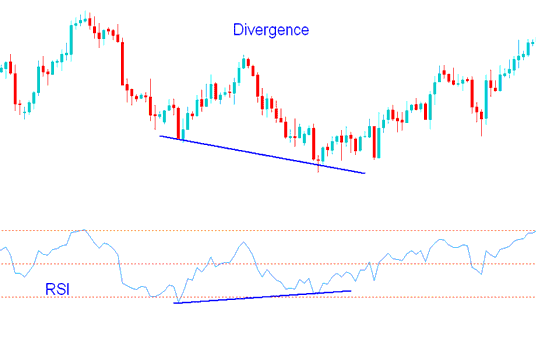
RSI Divergence Bitcoin Setup - Bitcoin Trading Divergence using RSI Crypto Technical Indicator
How to spot bitcoin trading divergence
In order to spot this cryptocurrency divergence setup we look for the following:
HH=Higher High- 2 highs but the last one is higher
LH= Lower High- 2 highs but the last one is lower
HL=Higher Low- 2 lows but the last one is higher
LL= Lower Low- 2 lows but the last one is lower
First let us look at the illustrations of these bitcoin trading terms
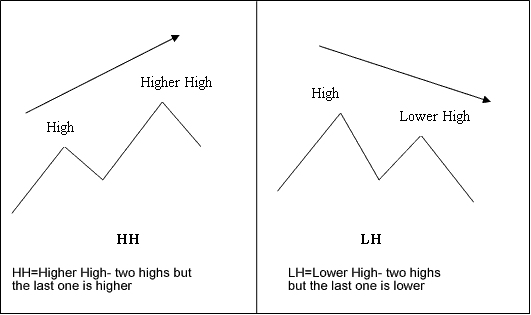
Divergence Bitcoin Trading Terms Definition
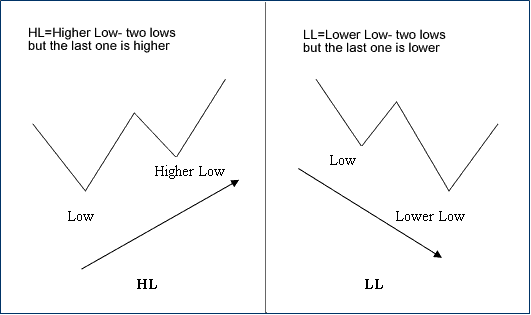
Bitcoin Divergence Terms Definition Examples
There are two different types of cryptocurrency trading divergence setups:
- Classic BTCUSD Trading Divergence
- Hidden Bitcoin Trading Divergence