RSI Bitcoin Indicator Chart Setups and Bitcoin Trend Lines
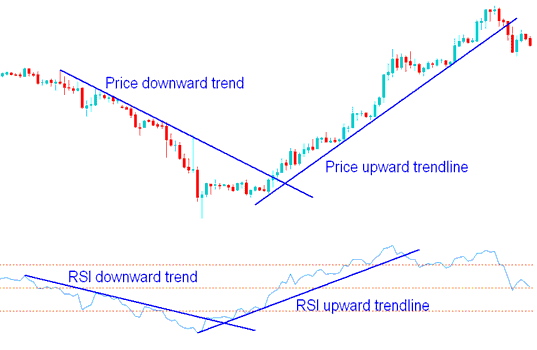
Chartists can plot bitcoin trendlines upon the RSI indicator, mirroring the procedure for drawing them on bitcoin price charts. RSI bitcoin trendlines are established identically to standard bitcoin chart trendlines: by connecting consecutive peaks or consecutive troughs of the RSI cryptocurrency measurement tool.

RSI Bitcoin Trend-Lines & Bitcoin Trendlines in Bitcoin Charts
RSI Bitcoin Chart Pattern Setups in Bitcoin Trading
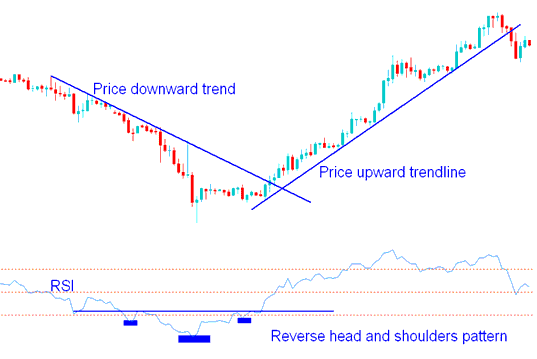
RSI Chart patterns like head & shoulders chart patterns or triangle bitcoin trading patterns which are not evident on the bitcoin price chart are often formed on this RSI bitcoin technical indicator.
The RSI cryptocurrency indicator frequently creates patterns in the cryptocurrency market, including formations such as head and shoulders or triangles, which may be distinct or not visible on the bitcoin price chart. The chart below clearly illustrates the Reverse Head and Shoulders reversal setup as seen with this bitcoin trading RSI indicator.

BTCUSD CryptoCurrency Patterns on RSI Chart Indicator
Trading with RSI Crypto Indicator to Identify Support & Resistance Levels
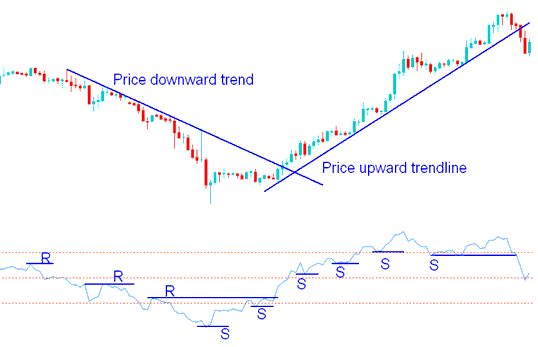
Support and resistance zones often show clearer on the RSI than on the Bitcoin price graph.
In an ascending market trend, support zones must remain unbroken: if they fail, the bitcoin price will breach these support areas, leading to a reversal of the upward momentum in bitcoin.
In a bitcoin downtrend, resistance holds firm. A break means prices push up, ending the drop.

Support & Resistance Levels on RSI Crypto Indicator
In the trading example shown above, when the third resistance level was broken, the downward bitcoin trend changed to an upward bitcoin trend, and when the sixth support was broken, the upward cryptocurrency market trend changed and broke the upward bitcoin trendline.
Get More Courses and Tutorials:
- How to Analyze Charts in a Downward Trend?
- Trading Setups Based on Bullish Divergence Detected on the BTC USD Trade Platform
- How to Open MT5 Bitcoin Trade Demo Account
- How to Analyze & Draw a Trendline in a Trading Chart
- Step-by-Step: Trading BTC/USD on MT4
- Place Pending BTCUSD Orders on MT5 iPhone App
- Learn Bitcoin Setups Described with Examples
- What's an Evening Star Candlesticks?
- How Do I Interpret When a BTCUSD Upward Trend is Starting?
- How to Add and Draw Trendlines in Trading Charts
