How to Add Choppiness Index Indicator on MT4 Charts - Adding MT4 Choppiness Index Indicator
Step 1: Open Navigator Window on Forex Trading Platform
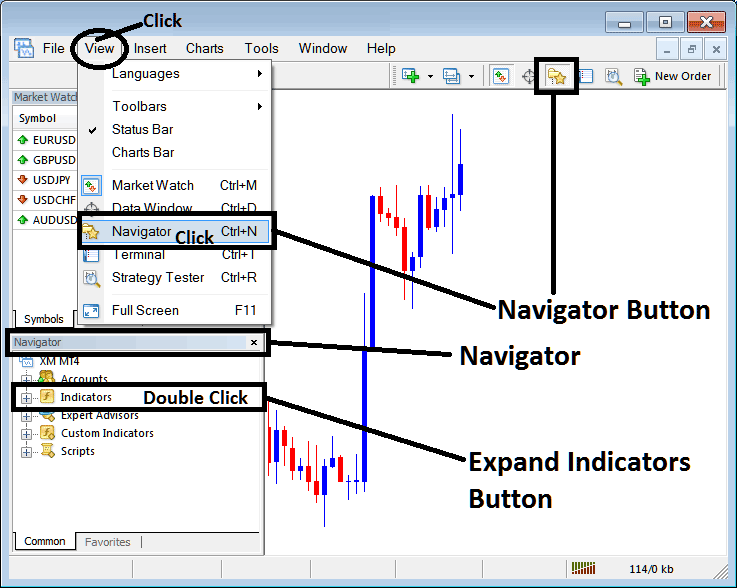
Open Navigator window as shown & illustrated below: Go to 'View' menu (click on it), then select 'Navigator' window (click), or From Standard Tool Bar click the 'Navigator' button or press keyboard short cut keys 'Ctrl+N'
On Navigator window, choose 'Indicators', (Double-Click)
How to Add Choppiness Index Indicator on MetaTrader 4 - MT4 Choppiness Index Indicator
Step 2: Expand the Indicators Menu on the Navigator - Adding Choppiness Index MT4 Indicator
Expand the menu by clicking the expand button marker (+) or double click the 'indicators' menu, after this the button will appear as (-) and will now display a list as shown below - select the Choppiness Index forex chart indicator from this list of forex indicators so as to add the Choppiness Index indicator on the forex chart.
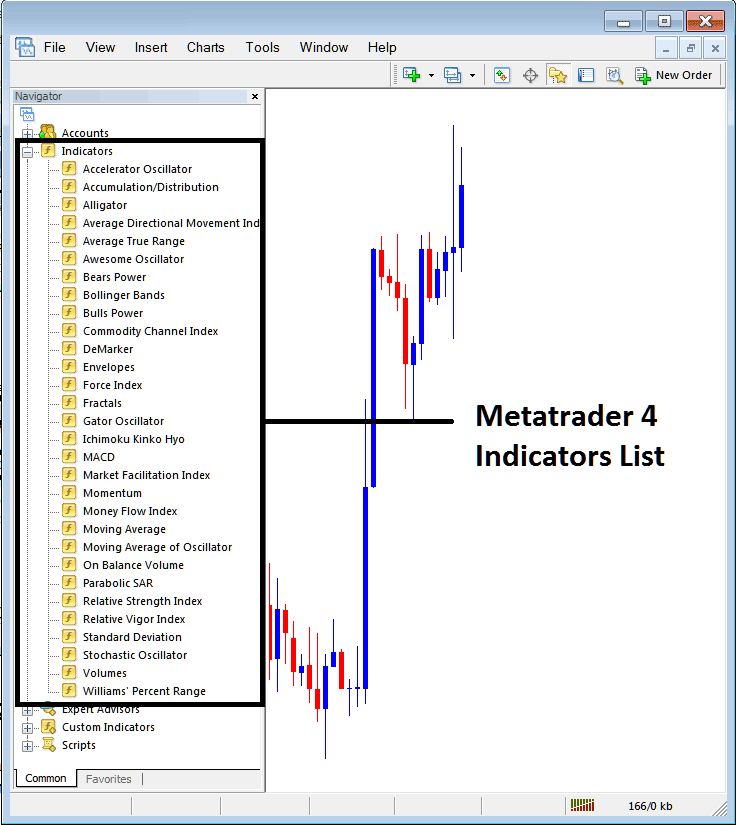
How to Add Choppiness Index Indicator - From the Above window you can then place Choppiness Index indicator that you want on the Forex chart
How to Add Custom Choppiness Index Indicator to MT4
If the technical indicator you want to add is a custom indicator - for example if the Choppiness Index technical indicator you want to add is a custom indicator you will need to first add this custom Choppiness Index indicator on the MT4 platform & then compile custom Choppiness Index indicator so that the newly added Choppiness Index custom indicator pops up on the list of custom indicators in MetaTrader 4 software.
To learn how to install Choppiness Index indicators on MT4, how to add Choppiness Index indicator window to MT4 and how to add Choppiness Index custom indicator in MT4 - How to add a custom Choppiness Index indicator in MetaTrader 4.
About Choppiness Index Technical Indicator Guide
Choppiness Index Technical Analysis and Choppiness Index Signals
Developed by E.W. Dreiss
Choppiness Index was designed to be an easy but practical indicator to help Forex traders to determine if the currency prices are trending or consolidating.
This Indicator is similar to ADX which is also designed to evaluate the strength or momentum of a trend and determine if the market is trending or consolidating.
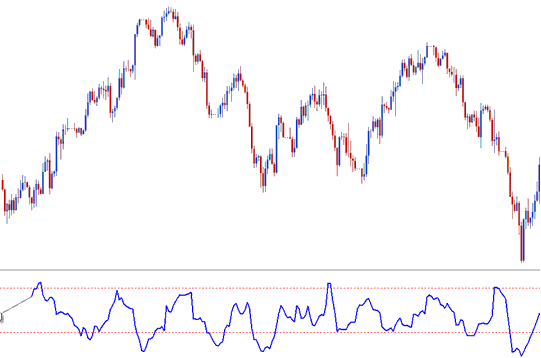
The Choppiness Index uses a scale of between 0 and 100. It also typically uses upper and lower bands at 61.8 & 38.2 respectively.
This indicator is plotted by first calculating the true range for each period and then adding the values of n-periods.
Second, it calculates the highest value and lowest value over n-periods and calculates their difference.
Third, it divides the sum of the true ranges and calculates the base-10 logarithm of this value.
Finally, it divides this value by the base-10 logarithm of n-periods and multiplies the results by 100.
Forex Technical Analysis & Generating FX Signals
Choppiness Index is a directionless indicator meaning it doesn't determine in which direction the forex market is moving.
Its basic principle is that the more heavily the market is trending over the last number of n-periods the closer to zero the Choppiness Index will be and the more heavily the market is consolidating that is moving sideways in a ranging or chopping manner, over the last n-periods the closer to 100 the Choppiness Index will be.
Indicator values of above 61.8 indicate that the market is ranging/ choppy (moving sideways and consolidating).
Higher values occur during/after a strong consolidation phase. Higher values could also be interpreted as a signal of a potential upcoming breakout after a significant consolidation has occurred.
Choppiness Index values of below 38.2 indicate that the market is trending.
Lower values occur during/after a strong trending phase. Lower values could also be interpreted as a signal of a potential upcoming consolidation and choppiness after a strong trend phase has occurred.


