Bollinger Percent B Forex Technical Analysis Signals
Created by John Bollinger
Percent B indicator is derived from Bollinger Bands.
This is an oscillator MT5 indicator MT5 indicator which has 3 lines - 0, 50, 100
- 0 represents lower Band
- 50 represents middle Band
- 100 represents upper Band
Percent B oscillates between these three points & it shows where the price is in relation to the 3 Bollinger Bands.
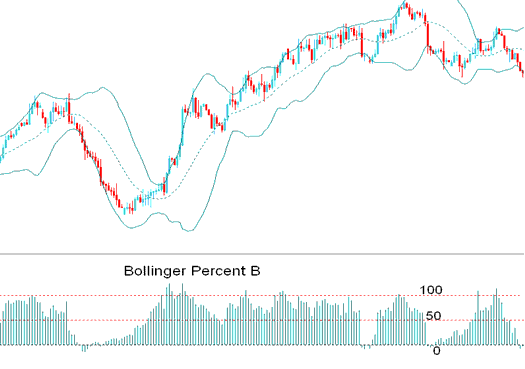
%b indicator
When the forex price touches the upper band then the oscillator MT5 indicator MT5 indicator hits 100, if forex price moves above the upper band the oscillator MT5 indicator MT5 indicator moves to +100
When the forex price touches the lower band then the oscillator MT5 indicator MT5 indicator hits 0, if forex price moves below the lower band the oscillator MT5 indicator MT5 indicator moves to -0
When the forex price touches the middle band then the oscillator MT5 indicator MT5 indicator will be at 50.
Calculation
Percentage B = Currency Forex Price Close - Lower Band * 100
Upper Band - Lower Band
Forex Technical Analysis & How to Generate Signals
Percent B indicates to what degree the forex price closes above or below any of the bands.
Buy Forex Signal
Oscillator MT5 Indicator values above 50 is a bullish signal.
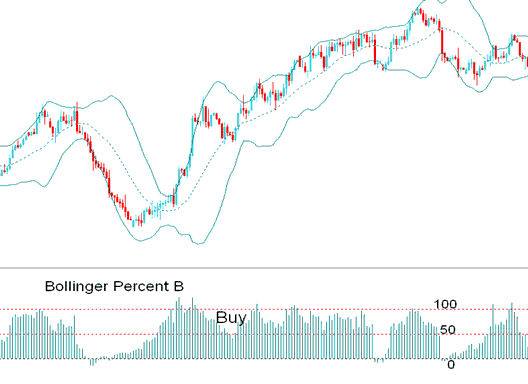
% b Bullish Buy Signal
Sell Trading Signal
Oscillator MT5 Indicator values below 50 is a bearish signal.
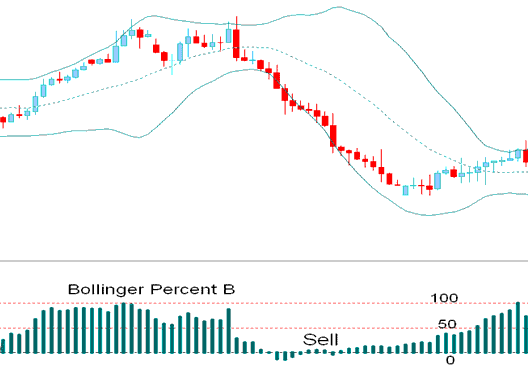
%b Bearish Sell Signal


