Multiple Timeframe Analysis
Employing multiple timeframes for gold analysis involves using two chart time durations: a shorter one for executing trades and a longer one to ascertain the prevailing trend.
It is beneficial to adhere to the trend: thus, in Multiple Time-frame Analysis, the extended time-frame reveals the direction of the long-term trend.
If the long-term market direction matches the short-term price move, your odds of profit rise. Even if you err, the big trend pulls you through. Trading with the market flow puts you ahead most times. That's the point of this technical analysis.
Gold and stock traders often say: "The trend is your friend." Always trade with the market, not against it.
There are four distinct categories of traders: each employs different charting formats for their transactional activities, as shown below.
How Traders Use XAUUSD Multi-Timeframe Analysis in Examples
Scalpers
This group of traders keeps their trades open for just a few minutes. A scalper never keeps a position open for longer than 10 minutes, aiming to make small profits of 5 to 20 pips.
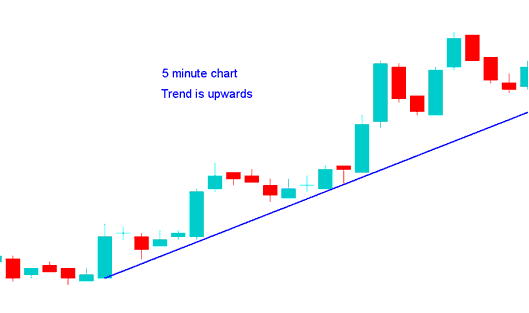
A scalper using a 1-minute chart wants to buy, checks a 5-minute chart, which looks like the one below: since the 5-minute chart shows an upward trend, they decide it's okay to buy.

Day Traders
This group retains their trades transactions for a few hours, but no more than a day. Aiming to generate a fair amount of pips: 30–100 pips.
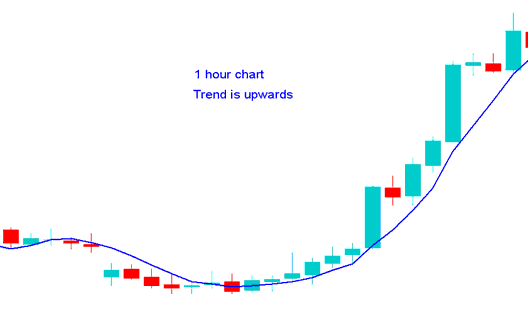
A day trader using a 15-minute chart timeframe desires to enter a long position, so they examine the 1-Hour chart (like the one shown below). Seeing that the 1-hour context indicates an upward price trajectory, they proceed with the decision to buy based on the analysis.

Swing Traders
Swing traders hold positions for days up to a week. Their goal is to grab 100 to 400 pips.
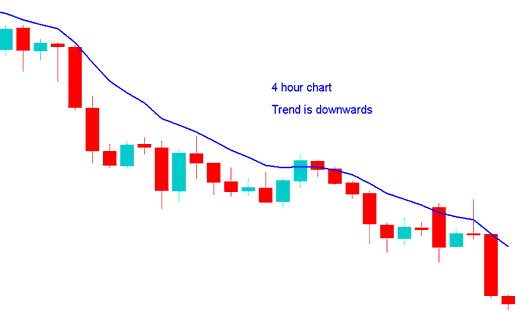
A swing trader using the H1 chart to trade short checks the 4-hour chart, which looks like the example below: because the 4-hour chart shows the trend is going down, they decide it's okay to sell.

Position traders
These investors hold their trades for weeks or even months. Their main goal? Racking up big gains - 300 to 1000 pips.
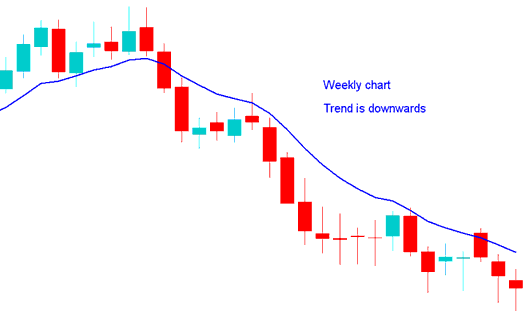
A position trader who wants to short on the daily chart checks the weekly chart too. If the weekly shows a downtrend, they go ahead with the trade based on that analysis.

How to Define A XAUUSD Trend
This system incorporates three indicators - the MA (Moving Average) Crossover System, RSI, and MACD - and relies on straightforward rules to define the market's direction. The applicable Trading Rules are:
Upwards trend
Both MAs Moving Up
RSI above 50 Mark
MACD Above Center Line
Downward Trend
Both MAs Moving Down
RSI below 50 Mark
MACD Below Centerline
For more comprehensive specifics concerning this systematic strategy, refer to: Methods for Signal Generation Using a System.
More Topics:
