What's Bull Flag Chart Pattern in XAUUSD?
Trading Gold Identify a Bull Flag XAUUSD Pattern in XAUUSD
The Best Trading Patterns Tutorial for Beginners - How to Identify & Trade Bull Flag Chart Pattern
Gold Chart Patterns for Day Trading - Trading XAUUSD Patterns Guide
This Bull Flag patterns charts guide explains how to identify xauusd patterns - identifying xauusd chart patterns is the first step when it comes to learning how to trade with Bull Flag xauusd chart patterns in XAUUSD.
Bull Flag gold trading price patterns commonly form on XAUUSD charts and this chart pattern analysis guide explains how to trade and analyze xauusd charts using Bull Flag gold trading patterns.
Bull Flag Trading Pattern
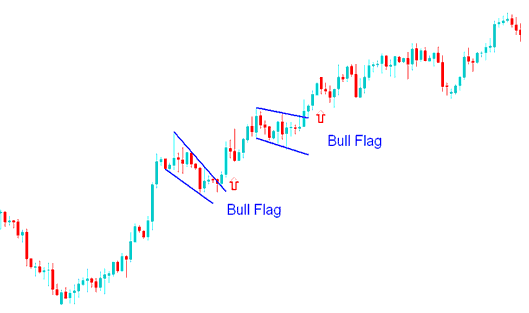
This bull flag pattern forms what looks like a rectangle. The rectangle is formed by two parallel lines that act as support & resistance for the gold trading price until the gold price breaksout. In general, the bull flag chart pattern will not be perfectly flat but it will be sloping.
The bull flag pattern is found within a XAUUSD upward gold trend. In this bull flag chart pattern is a continuation pattern where the xauusd market retraces slightly, it is therefore a slight retracement with narrow gold trading price action that has a slight downwards tilt. The technical buy point is when price penetrates the upper line of the bull flag pattern. The flag portion has highs & lows which can be connected by small lines which are parallel, giving it what looks like a small channel.
The bull flag pattern occurs at halfway point of a bullish upwards xauusd trend & after a breakout a similar move equivalent to the height of the flagpole is expected.
Bull Flag Chart Pattern - What is Bull Flag Chart Pattern in XAUUSD?
The bull flag pattern above was just a resting period as the xauusd market gathered strength to break out and move higher. Bull flag chart pattern xauusd continuation signal was confirmed as a upper line was broken to the up-side.


