What's Ascending Triangle Chart Pattern in XAUUSD?
Trading Gold Identify a Ascending Triangle XAUUSD Pattern in XAUUSD
The Best Trading Patterns Tutorial for Beginners - How to Identify & Trade Ascending Triangle Chart Pattern
Gold Chart Patterns for Day Trading - Trading XAUUSD Patterns Guide
This Ascending Triangle patterns charts guide explains how to identify xauusd patterns - identifying xauusd chart patterns is the first step when it comes to learning how to trade with Ascending Triangle xauusd chart patterns in XAUUSD.
Ascending Triangle chart pattern in gold trading price patterns commonly form on XAUUSD charts and this chart pattern analysis guide explains how to trade and analyze xauusd charts using Ascending Triangle gold trading chart patterns.
Ascending Triangle Trading Pattern
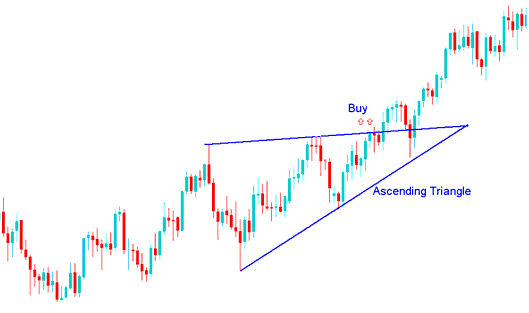
The ascending triangle xauusd chart pattern in xauusd is formed in a xauusd up trend & it shows that upward direction of the market is going to continue.
Ascending Triangle xauusd chart pattern shows that there is a resistance level that the buyers keep pushing each time moving it higher, & once it breaks-out gold trading price will continue heading upward.
The overhead resistance temporarily prevents the gold market from advancing higher, while the rising xauusd trend line beneath the pattern signals that buyers are still present. An upside penetration of the upper line is a technical buy trading signal for a market breaking out from an ascending triangle trading pattern.
Ascending Triangle xauusd chart pattern is found within a XAUUSD upward xauusd trend, the ascending triangle pattern forms as a consolidation period within the up xauusd trend & indicates upside xauusd trend continuation will follow.
Trading Gold Identify a Ascending Triangle XAUUSD Pattern in XAUUSD?
The market formed an ascending triangle chart pattern during its up xauusd trend which led to upside continuation. Buy point is when price clears the upper sloping line & the xauusd market continues heading upward.


