How to Analyze Inverse Head and Shoulders Chart Pattern
XAUUSD Trade Inverse Head and Shoulders Chart Pattern
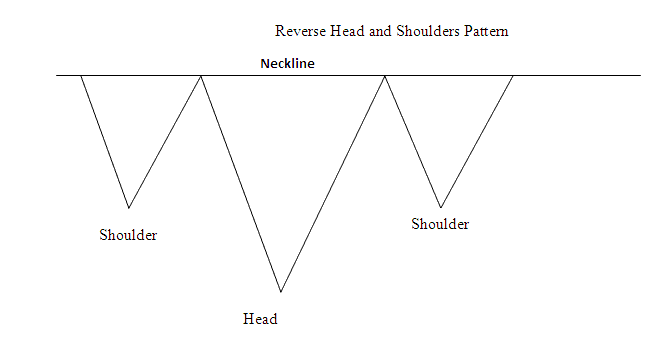
Inverse Head & Shoulders Chart Pattern is a reversal chart pattern that is formed after an extended xauusd downward trend move. Inverse head and shoulders chart pattern resembles an upside down head and shoulders chart pattern.
Inverse Head & Shoulders Pattern is considered complete once the gold price penetrates and moves above neckline - the neckline is drawn by joining the 2 gold price peaks that are between the inverse shoulders.
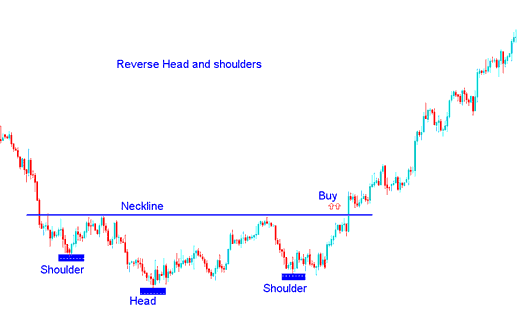
To open a buy xauusd trade - traders place their buy stop pending orders just above the neck line region.
Summary: How Do You Interpret Inverse Head and Shoulders Chart Pattern?
- Inverse Head & Shoulders XAUUSD Chart pattern forms after an extended xauusd downward trend move
- Inverse Head & Shoulders Chart Pattern signals that there will be a reversal in the downward xauusd trend
- Inverse Head & Shoulders Pattern formation resembles an up-side down head and shoulders pattern - thus its name - Inverse Head and Shoulders Pattern.
- XAUUSD traders will buy when price breaks-out above the neck line: as explained on the inverse head and shoulders chart pattern example shown below.
How Do You Analyze Inverse Head & Shoulders Chart Pattern
Inverse Head and Shoulders Chart Pattern on a Gold Chart - Read Inverse Head and Shoulders Chart Pattern
How to Read Inverse Head and Shoulders Chart Pattern
How Do You Analyze Inverse Head & Shoulders Chart Pattern


