CCI Technical Analysis and Commodity Channel Index Signals
Created by Donald Lambert
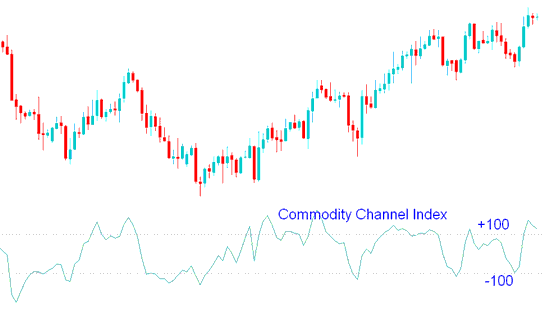
The Commodity Channel Index evaluates the fluctuation of a commodity's price in relation to its statistical mean (average).
This oscillator moves between high and low levels.
A high CCI value means price sits way above its average. It highlights unusual strength.
when the CCI is low it shows that rate is surprisingly low in comparison and analyzed to its common.
Gold Technical Analysis and Generating Signals
Over-bought/ Over-sold Levels
The CCI commonly oscillates between ±100.
Indicator values or readings exceeding +100 signify overbought conditions and a forthcoming market correction.
Readings from the indicator falling below -100 signify an oversold market state, suggesting a forthcoming price correction.
Buy Signal
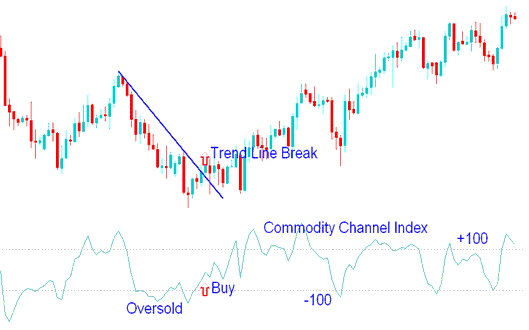
When the Commodity Channel Index (CCI) indicator reads below -100 (oversold territory), it suggests an impending market correction.
Over-sold conditions will persist until the Commodity Channel Index indicator commences its ascent above the -100 level.
When price begins moving above -100 then that's interpreted as buy.
The Commodity Channel buy signal should be paired with a trendline break signal to validate the buy.
Buy Trade
Sell Trading Signal
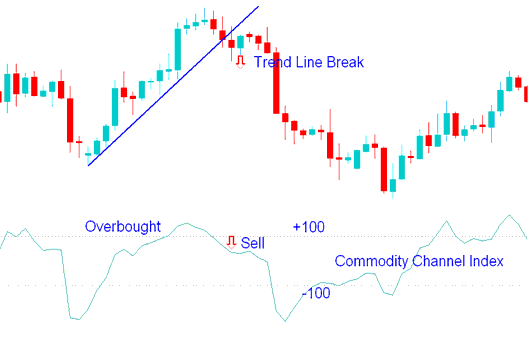
If the CCI is overbought, with levels exceeding +100, a market correction is likely to occur.
Overbought levels persist until the Commodity Channel Index initiates movement below +100.
When price starts moving below +100 then that's a interpreted as sell.
This Commodity Channel sell signal should be corroborated by a trendline break signal to affirm the sell indication.
Sell Trade
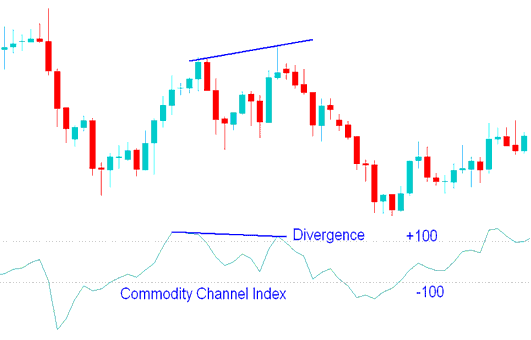
Divergence XAU/USD
Bullish Divergence Trading Setup
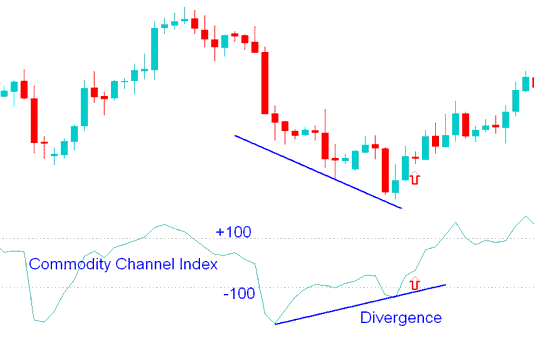
A bullish divergence happens when the price makes new lows, but the CCI indicator doesn't go lower than its previous low point.
This outcome indicates a bullish divergence, implying that the subsequent pattern setup will likely be followed by an uptrend market recovery.
Bearish Divergence Trade Setup
Bearish Divergence happens when the price makes new highs while the CCI indicator fails to go higher than its previous high point.
This observation signifies a bearish divergence, suggesting that the emergent pattern configuration is likely to precede a downward market correction.
Technical Analysis in Gold Trading
More Topics:
