
Trading Gold Using Pivots
Pivot Points constitute a set of analytical tools originally devised by floor traders dealing in commodity futures to aid in pinpointing prospective market turning points. These potential reversal levels became known as pivot points. The calculation of these pivot point levels is systematically performed to delineate price thresholds where the prevailing market sentiment might shift, moving from bullish to bearish, or the reverse.
Gold traders use these points as markers of support and resistance zones.
These calculated pivot point values are determined by averaging the high, low, and closing prices from the preceding trading session:
Pivot Point = (High + Low + Close) / 3
Day traders utilize calculated pivot point levels to determine entry points, establish stop loss levels, and set take profit levels. These pivot point levels aim to pinpoint where the majority of gold traders are placing their orders simultaneously: for instance, when all gold traders are engaging in the same actions.
In trading analysis, pivot point levels serve as crucial technical indicators for gold traders to forecast price movements. This XAU/USD indicator is derived from the average of significant prices (high, low, and close) from the preceding trading period.
Bullish Sentiment - If the prices trade above the central pivot point in the next price period, this is considered a sign of bullish sentiment. Bearish Sentiment - On the other hand, if the prices trade below the central pivot point in the next price period, it is viewed as a sign of bearish sentiment.
The central pivot point helps set extra support and resistance levels. Add or subtract price ranges from past data to place them above or below the pivot.
A Pivot Point, along with its corresponding support and resistance thresholds, frequently serves as a fulcrum for price movement direction changes.
In an upward trend, the price stays above the pivot point: resistance zones may act as a ceiling for the price, and if prices go above these levels, the uptrend might not last, and a pullback could happen.
In a downward trend, the price is usually below the pivot point, and the support levels might act as a bottom for the price: if prices fall below these levels, the downtrend might not last, and the price may go up again.
The Central Pivot Point is instrumental in calculating support and resistance zones using the following formula:
Pivot points comprise a central level, flanked by three support levels situated beneath it and three resistance zones positioned above it. These calculations were initially favored by floor traders in equity and futures exchanges because they offered Gold traders a rapid gauge of the market's intraday trajectory. In the ensuing years, the utility of these pivot point levels proved to be highly valuable across other trading markets as well.
People love pivot points because they're seen as “leading” indicators. They try to predict what's coming, not just react to what already happened.
Use yesterday's high, low, and close to find pivot levels for today. This 24-hour indicator follows these formulas:
The central pivot point can be employed to ascertain three support and three resistance zones as follows:
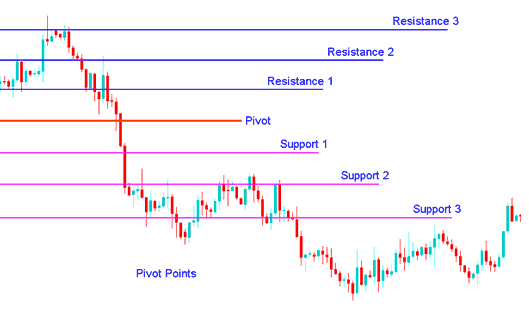
Resistance 3, Resistance 2, Resistance 1, Pivot Point, Support 1, Support 2, Support 3
The Pivot Points indicator is shown:
XAUUSD Trading Using Pivots
Pivot Point Technical Analysis
The center pivot point itself shows a level of the strongest resistance/support depending on how the market feels overall. If the market is stuck in a range and going nowhere, then the price will usually move a lot around this level until a breakout happens.
Prices going above/below the main point shows the feeling is positive & negative, respectively. Pivot Points indicator is a tool that points out potentially new highs or lows inside a set amount of time beforehand.
Support and resistance levels serve as exit spots. Say prices trend up past the pivot point. They hit the first resistance, then the second. Traders close buy positions at the second one. Reversal odds rise with each resistance hit.
When looking at pivot points, there are usually 3 levels above and below the main pivot point that people pay attention to. These levels are worked out from how much the price moved in the last trading period and then added to the main pivot for areas of resistance and taken away from the main pivot for areas of support.
Pivots Points technical analysis is used in 3 ways:
Trend Direction: Central pivot point is useful when determining the general trend of XAUUSD Gold prices. Trades are only opened in the direction of price trend. Buy trades are opened when price of XAUUSD is above the central pivot point & sell trade positions are opened when the price of Gold is below the central pivot point.
Price Breakout: In a price breakout a bullish signal is when prices break upwards through the central pivot point or one of the resistance zones (mostly Resistance 1). A sell signal is when price breaks downwards through the central pivot point or one of the support zones (commonly Support 1).
Regarding Trend Reversals: A buy signal confirming a trend reversal materializes when the price moves towards a defined support level, often Support 2 or Support 3. If the price of Gold either makes contact with this support zone or briefly traverses it, and subsequently reverses course to move in the opposite direction, this signals a potential reversal.
A sell signal happens when the price of Gold moves toward a resistance area, like Resistance 2 or Resistance 3, and the price of xauusd reaches that area or goes slightly past it, then turns around and starts to go the other way.
Find More Explanations & Educations:
- Expert Advisor (EA) Setup Utilizing the Forex DeMarks Projected Range
- Setting Stop Loss FX Orders Using Support Resistance Levels
- How Do I Place GBPSEK Chart in MetaTrader 4 Program?
- Morning Star Setup, Evening Star Setup & Bullish Engulfing & Bearish Engulfing Candles
- Beginner Forex Trader Guide Tutorial Lesson
- Finding Crude Oil Symbol in the MT5 Platform
- Bulls Power XAU USD Indicator Analysis in Gold
- How to Use MT5 Rate of Change, ROC Indicator
- IT40 System