Bulls Power Technical Analysis and Bulls Power Signals
Created by Alexander Elder
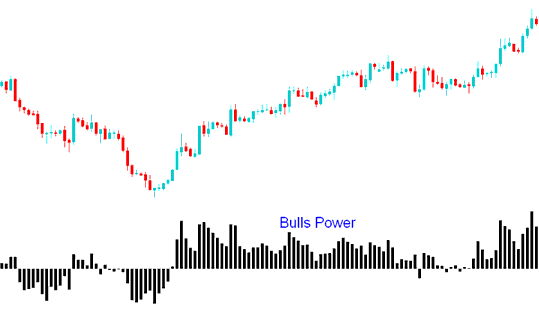
Bulls Power is utilized to assess the strength of the Bulls (Buyers). It gauges the power balance between bulls and bears.
This technical tool is designed to ascertain whether a positive trend is poised to persist or if the price has reached a juncture where a reversal might occur.
Calculation
A price bar consists of four components: the Opening, Closing, High, and Low prices.
Each Price bar either closes higher or lower than previous gold price bar.
The maximal gold valuation recorded accurately reflects the peak influence exerted by bullish traders during that specific gold price cycle.
The lowest gold price will indicate the maximum strength of the Bears during a specified gold price period.
This Indicator uses the High of the price & a MA (Exponential MA)
The MA represents the middle ground among sellers and customers for a certain gold charge length.
Therefore:
Bulls Power = High Price - Exponential Moving Average

Bulls Power
Gold Technical Analysis and How to Generate Trading Signals
Buy Signal
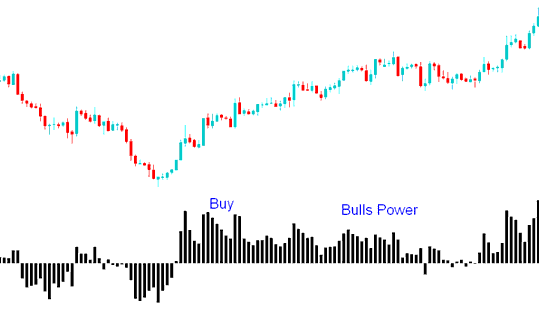
A Purchase Signal is Established When the Bulls Power Oscillator Indicator's Reading Rises Above the Zero Mark.
In an up trend, the HIGH is higher than Exponential MA, so the Bulls Power is above zero and Histogram Oscillator is located above the zero-line.

Exit Signal
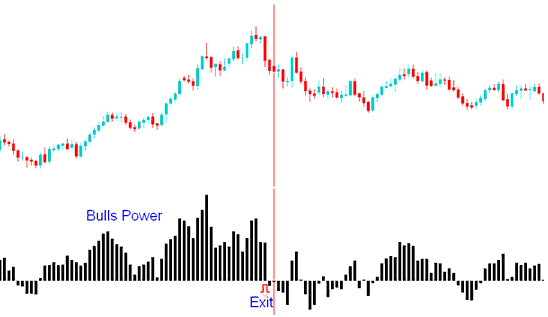
When the high drops below the EMA, gold starts to fall. The Bulls Power bars cross under zero.

The Triple Screen trading strategy for this technical indicator recommends determining the price trend on a higher time frame (such as daily) while applying trend confirmation on a lower time frame (such as hourly). Trades should be executed in sync with the signals generated by the technical indicator, but only in the direction of the long-term trend as established by the higher time frame.
Study More Guides & Courses:
- Demarker Analysis in Foreign Exchange Charts
- The S&PASX 200 Index Symbol/Quote Presentation within Forex Markets
- What's the Best XAU USD Leverage for $200 in Gold?
- How to Use the XAG/USD Chart to Trade XAGUSD
- What is the difference between classic bullish trade divergence and classic bearish divergence?
