
Divergence Setups Trading XAUUSD Using Divergence Setup
Divergence setup is a way that XAU USD traders look at Gold prices to understand them and try to guess where the gold prices will go next. It means looking at the Gold price chart and one other sign. For this example, we will use the MACD sign.
To find this setup, look for 2 spots on the chart where the price makes a new high or a new low, but the MACD indicator doesn't, which means that the price and the momentum are not in agreement.
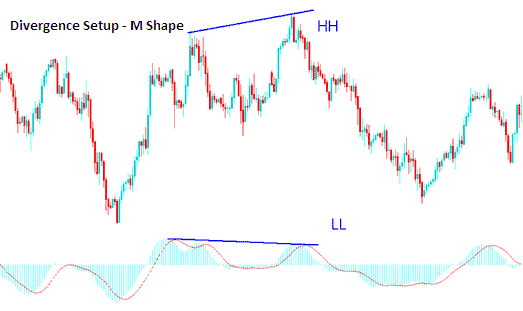
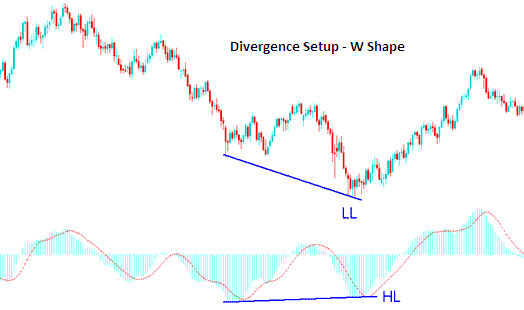
For divergence trade setups, spot two points. Look for two highs that make an M on the gold price chart. Or find two lows that form a W on the gold price chart. Then check for the same M or W shape on the indicator you use for trades.
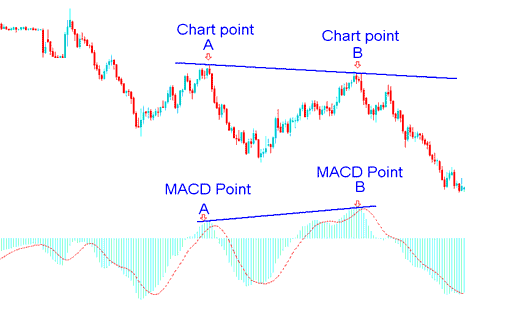
Explanation of a Gold Price Divergence Setup:
On the gold chart below, points A and B mark swing highs that shape an M pattern.
Next, look at the MACD indicator. Check its peaks that sit just under chart points A and B.
One line is plotted on the gold price chart and another on the MACD indicator, as depicted below.
Gold - Divergence Trade Setup - Drawing Divergence Lines
The XAUSUD price chart shown above gives an example of one of the 4 kinds of divergence trading setups: the one shown is called hidden bearish divergence, which is a great kind to trade. Different kinds of divergence trading setups are described later.
How to identify divergence Trade Setup
In order to spot Gold divergence signal we check for the following:
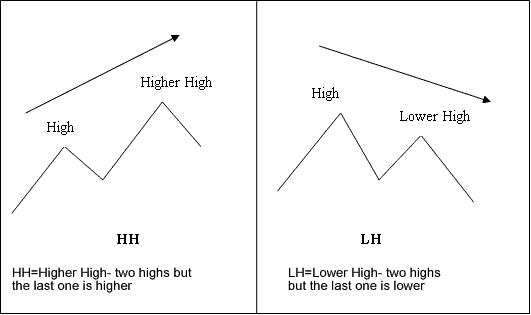
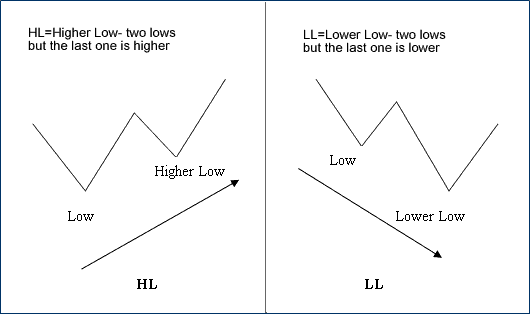
HH = Higher High - two highs but last is higher, LH = Lower High - 2 highs but last is lower, HL = Higher Low - two lows but last is higher, LL = Lower Low - two lows, with the last being lower.
First let us look at the exemplifications of these terms:
M shapes dealing with price Highs
W Shapes dealing with the price lows
The concepts mentioned above are elaborated upon below, utilizing XAU USD price charts and the MACD indicator.
Explanation of M Shapes on Gold Price Charts
Explanation of W Shapes on XAUUSD Gold Price Charts
You now know the terms for divergence trading patterns. Next, we cover the two divergence types. Learn to trade them on XAUUSD charts.
There two types are of divergence set-ups:
- Classic Divergence Setup
- Hidden Divergence
These two divergence trading set-ups are presented on the next tutorials.
More Guides and Topics:
- Darvas Box Forex Trade Signal to Buy and Signal to Sell
- How Can I Study Upward Pointing Bull Flag Chart Shapes?
- How Do I Add Trade Pair in MT4 Trade Platform?
- MACD Index Trading Plans Class Instructions
- Indicator MetaTrader 4 Hull Moving Average(MA) Indicator
- Bollinger Bands Double Tops & Double Bottoms Trend Reversal
- Steps to save a workspace or trading strategy in MT4
- How Do I Start Learning Gold Tutorial Course?
- Details on Regulated Brokers for XAUUSD Trading
- Identifying Buy and Sell Signals with Moving Average (MA) Envelopes