How Do I Analyze Bull Flag Chart Pattern?
How Do You Trade Bull Flag Chart Pattern?
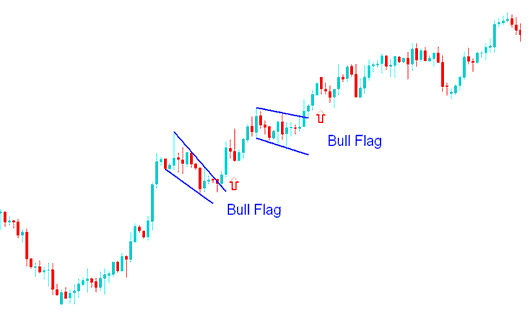
Bull flag chart pattern forms what looks like a rectangle pattern with a slight downwards tilt. The rectangle is formed by two parallel lines that act as support level and resistance level for forex price until the FX price breaks-out. In general, the bull flag chart pattern will not be perfectly flat but it will be sloping and having a slight tilt.
The bull flag pattern is found within an upwards forex trend. Bull flag pattern is a continuation chart pattern where the price retraces slightly, bull flag chart pattern is therefore a slight forex price retracement with narrow forex price action which has a slight downward tilt. The buy signal is generated when the price penetrates the upper line of the bull flag chart pattern. The flag portion of the bull flag chart pattern has forex price highs and FX price lows which can be connected by small lines that are parallel, and it looks like a small channel - flag.
The bull flag chart pattern occurs at halfway point of a bullish upwards forex trend and after a FX price break-out a similar move equal to the height of the flagpole is expected.
How Do I Interpret Bull Flag Chart Pattern?
The bull flag chart pattern shown above was just a resting period as the forex market gathered momentum to break out & move higher. Bull flag chart pattern continuation forex trading signal was completed when the upper line of this Bull flag chart pattern was broken to the upside after which the forex price continued to move upwards.
How Do I Interpret Bull Flag Chart Pattern?


