Piercing Line Candle and Dark Cloud Candle
Piercing Line and Dark Cloud candles seem much the same. But one forms at the peak of a gold uptrend, called Dark Cloud Cover. The other appears at the base of a gold downtrend, known as Piercing Line.
Upwards Trend Reversal - Dark Cloud Cover CandlesticksDownwards Trend Reversal - Piercing Line Candles
Piercing Line Candle
Piercing line candlestick is an extended black frame that's observed by way of lengthy white frame candlestick.
The white body cuts through the middle of the last black body.
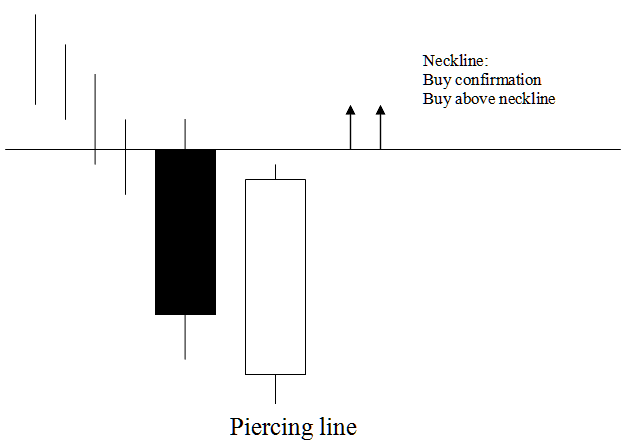
This piercing line candle acts as a bullish reversal at the end of a downtrend. The market opens low but closes above the midpoint of the prior black candle body.
This pattern means the downtrend is losing strength, and the market is probably about to turn and start heading up.
This piercing line candle pattern is displayed as a piercing line, which signals that the market is breaking through the bottom, showing a price floor for the Gold price's downward trend.
Piercing Line Chart Design
Technical Analysis Piercing Line Candle
A buy signal from the piercing line pattern confirms when price closes above the neckline. That neckline marks the open of the candle left of the piercing line. See the illustration above for details.
This is a bullish setup, so gold should keep climbing. If you're buying here, set your stop loss just below the recent low.
Dark Cloud Candle
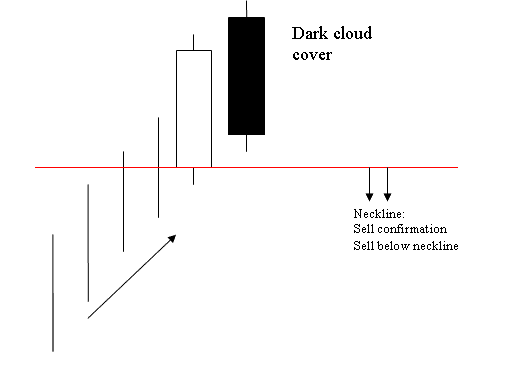
The dark cloud cover candle pattern is the inverse of the piercing line candle, typically manifesting at the peak of an upward market movement.
A dark cloud cover candle consists of a long white body followed by a long black body.
The black body cuts the mid-point of the prior white body.
The dark cloud cover candlestick represents a bearish pattern signaling a potential reversal forming at the peak of an uptrend.
This indicates that the market opens at a higher level and subsequently closes beneath the midpoint of the white body.
The Dark Cloud Cover candle formation indicates a waning of the upward momentum, suggesting that the trend is likely to reverse and transition into a downward movement.
This particular arrangement of candlesticks, known as a cloud cover, suggests that the cloud acts as an overhead resistance level for Gold's upward price trajectory.
Dark Cloud Candle Pattern
Technical Analysis Dark Cloud Candlestick
A sell signal from this candle pattern is confirmed when the price goes below the neck line, which is the opening price of the candle to the left, as shown in the picture.
In this bearish setup, gold prices are expected to continue declining. A trader opening a sell position should set a stop-loss just above the recent highest price level.
Find Additional Classes and Courses:
- Gold Forming Consolidation Setups & Symmetrical Triangles
- Rainbow MT4 Trading Indicator Described
- How to Set On Balance Volume Trading Indicator in Trading Chart on MT4 Software Platform
- Identifying RSI Patterns and Levels in Forex Trading
- What's the Value of 1 Pips in a Micro Forex Account?
- Trade XAUUSD Charts Using Pivot Points
- Using DeMark Range Extension Indicator for Stock Indices on MT4
- Kurtosis Gold Indicator Analysis in Gold Charts
- Utilizing the Chandes Momentum Oscillator in Forex
- What's CRUDE OIL Spreads?