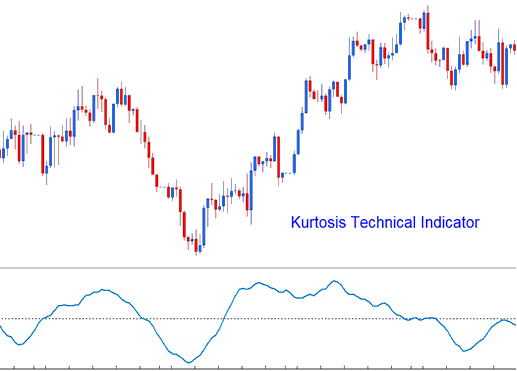
Kurtosis Technical Analysis and Kurtosis Signals
This technical indicator is used to help identify the sentiment of the market.
It's calculated in three parts.
- Kurtosis part
- Fast Kurtosis
- Fast/Slow Kurtosis
The Kurtosis part is calculated using the formula:
K equals the n-period momentum minus the n-period momentum from one bar earlier - so, it's the current candlestick's momentum minus the previous one.
The Fast Kurtosis part is calculated using the formula:
FK = n-periods MA(Moving Average) of K
Fast/Slow Kurtosis part is calculated using this formula:
FSK = n-periods MA(Moving Average) of FK

Technical Analysis and Generating Signals
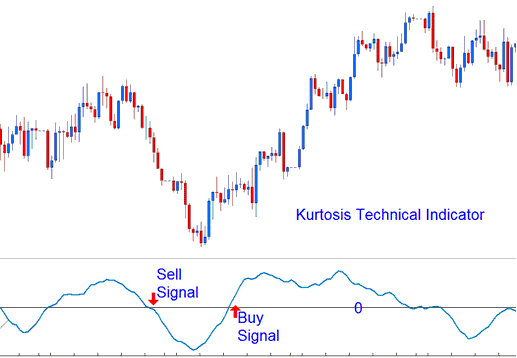
A bullish signal - a buy indication - occurs when a technical indicator crosses above the zero line.
Bearish Signal Generation: A directive to sell is issued when the indicator's value crosses below the equilibrium zero line.

Technical Analysis in XAUUSD
More Lessons:
