
XAUUSD Momentum Market Trends - Trade Parabolic XAU/USD Price Trends
What is a Momentum Trend? A momentum trend is a trend that has more force than the one before. This new trend can be shown with a trend line that's much steeper than the one before. When a new trend line is much steeper than the old one, it means the trend has gotten stronger. These kinds of situations need a different way to analyze the market for trading.
In the picture example shown here: Also, if the price goes up within a channel, and then it goes above the channel, the price goes up even more, like in the picture here. As a trader, if your price chart goes above an upward trend line in a market that is moving up, Don't try to sell: instead, buy more. Remember this tip about XAU USD: it can make you a lot of money, just like it did in the market study below.
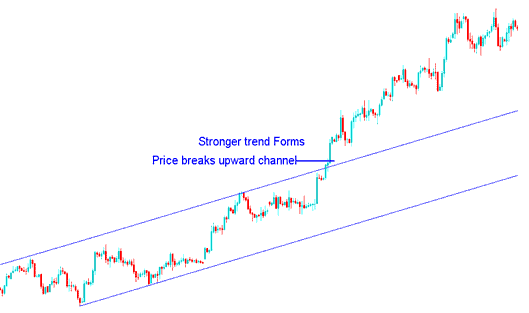
Momentum Price Trend - Channel Break Upward - Increased Momentum in an Upward Trending Market
Referring back to the trading analysis example mentioned earlier, we can also observe the formation of steeper trend lines, indicating that the price momentum is increasing.
This is demonstrated and illustrated by the more steeply angled trend-lines that can be plotted as price action progresses forward.
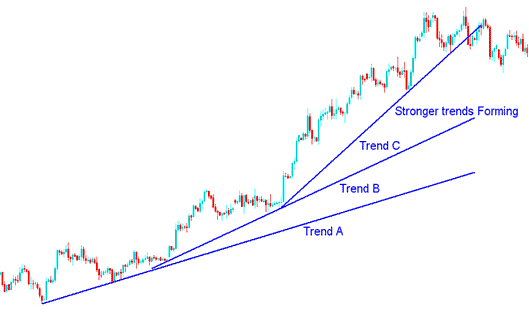
The new upward trend shows more strength than the last one. This appears in the steeper slope of the trend line.
This new trend creates lines B and C, as in the diagram below. Drawn with MetaTrader 4 analysis tools, it adds a sharper momentum line on the price chart.
This is displayed and shown in the example below by the three trend-lines A, B and C showing formation of stronger trends as the price continues to gather more force.
Gold Price Gaining More Upwards Momentum
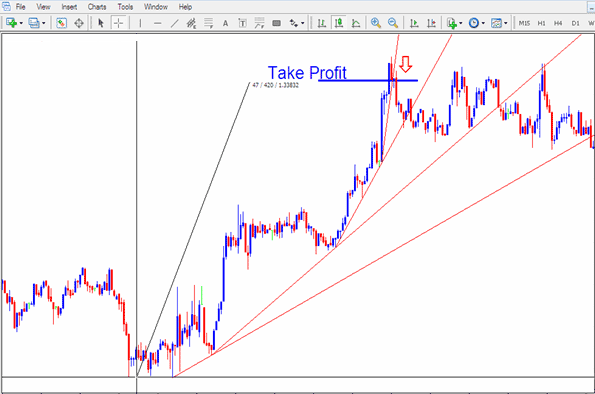
If the sharpest trend line breaks, the others likely will too. Take your profits when that main line snaps.
This plan also works for short-term Gold traders, such as day traders or scalpers, as this pattern often appears on 5-minute and 15-minute Gold price charts. These trend-lines that look like parabolas can show you where to set take-profit orders. A trader must quickly secure their profit once the steepest trend line is broken.
How to Trade These Momentum Market Trends Setups
The momentum trend lines are good tools for figuring out where to takeprofit early before other traders. This momentum trading setup occurs frequently on 1 minutes, 5 minute and 15 minute charts & thence appropriate for scalpers and day traders. For day trading, which is the most common approach, the optimal chart time frame to use is 15 minutes, and sometimes 5 minutes. For example, after entering a short-term trade, whether a buy or sell, if the market moves a few pips in your favor and you identify this pattern, it is advisable to exit once the steepest trend line is breached and take profit at that moment.
Technical Analysis Example
For this example, we will utilize the short-term trading chart - the 5-minute trading chart - to illustrate these trading setups. When the setup appears as shown below, it represents an opportune moment to execute a profit order.
Trading the Momentum Market Moves
In the example shown, a buyer would have waited for the steepest trend line to break and then ended their buy, taking gains at this moment and thus earning money on this buy. The buyer would have left the trade at the right time, avoiding the back-and-forth market that came after.
Parabolic Trends - What is it?
At times, prices can exhibit a parabolic pattern, particularly noticeable when panic buying occurs, causing the price of XAUUSD to surge dramatically. During such a parabolic rise, sellers are nearly absent, creating a buying vacuum. As a result, traders hastily enter the market without regard for the price to avoid missing out. These parabolic movements can lead to drastic price changes in a very short timeframe, prompting traders to continuously place buy orders in these conditions.
For this sort of move it's far satisfactory to maintain buying - no want for technical evaluation simply hold shopping for.
Sometimes, a trend just keeps going for months, maybe even a couple of years. As long as those weekly and monthly trend lines hold, just keep buying.
When a stock, currency pair, or gold price climbs like this, the peak often ends the rise. Prices seldom touch those highs again soon. At that spot, if the sharpest trend line snaps, view it as a reversal. Leave the market for now. Take your wins and relax. Plan your next step after a break.
Downtrends can spike with panic sales and sharp drops. This hits hard in recessions. Commodity prices just keep falling.
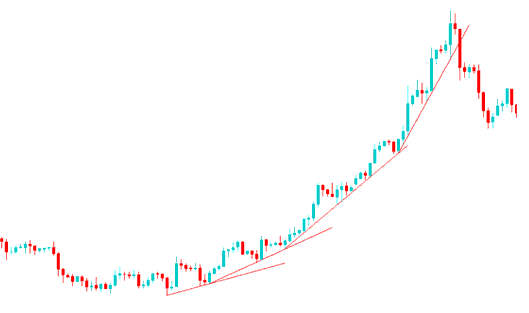
The steeper a trend-line is, the less you can count on it. If the steepest trend line breaks, it's best to stop this buy trade. The example below shows an oil chart that made a parabolic setup.
Parabolic Trend
If you, as a trader, observe a parabolic trend erupting in an upward trajectory market, continue executing buy orders - you stand to realize substantial profits: no supplemental trading analysis beyond the trend lines will be necessary. The crucial instruction is to exit immediately upon the breaking of the steepest trend-line, as reversals on this setup occur with extreme speed, demanding a swift response from you. Ensure your exit occurs at the precise level, mirroring the illustration provided above.
As an illustrative example, the parabolic surge previously shown pertains to the crude oil chart. Gold traders were instrumental in inflating the oil price from $70 to $150 over a few months. At the market peak, self-proclaimed market analysts were extremely positive, projecting an unprecedented oil price of $200. What these analysts failed to grasp was the principle of a parabolic market trend, sometimes termed 'Vacuum Buying.' In technical analysis, as long as the trend lines maintained their angle, the price trajectory was upward. However, even after the initial, steepest trend line was breached, these analysts persisted in their prediction of a $200 peak. The outcome? Following the breakdown of that critical steepest trend line, it took less than two weeks for the oil price to plummet back to $50: at one point, it even touched $35. This exemplifies parabolic trading analysis, and now you are aware of it.
Another instance of a very quick price change is XAUUSD, which developed and took place on the weekly/monthly chart around the same time when the steepest line on the oil chart broke. You could open the Gold chart and use the Weekly & Monthly chart periods in order to try to see these fast-rising trend setups for Gold prices.
Good examples of this pattern on charts are the weekly and monthly price charts for Gold and Crude Oil, and you can find these charts on the MetaTrader 4 platform, depending on your broker.
Examine more guides and topics
- Consolidated Checklist of Buy and Sell Indicators Derived from Average True Range (ATR) Methods
- Downloading XAU/USD Historical Data for MT4 Software
- Starting FX with MT4 FX Brokers and Learning Their Platform/Software Platforms
- Forex Trade MA Moving Average Crossover EA EA Setup
- Setting Up the FX Trade MA Moving Average Envelopes Expert Advisor