Piercing Line Candlesticks and Dark Cloud Cover candlesticks
Bullish CFDs Candlestick Patterns & Bearish CFDs Candlestick Patterns
A Piercing Line CFD Candlestick Pattern & Dark Cloud Cover Candlestick Pattern look alike but the difference is that one occurs at the top of a CFD Trading up trend (Cloud Cover) and the other occurs at the bottom of a downwards cfd trend (Piercing).
Upward CFD Trend Reversal - Dark Cloud Cover Candles
Downward CFD Trend Reversal - Piercing Line Candlesticks
Piercing Line Candlestick
Piercing line is a long black body followed by a long white body candlestick.
White body pierces the midpoint of the prior black body.
This is a bullish reversal cfd pattern that occurs at the bottom of a market downward cfds trend. It shows that the cfd market opens lower & closes above the midpoint of the black body.
This shows that the momentum of the down cfd trend is reducing & the cfd market cfd trend is likely to reverse & move in an upwards direction.
This cfd pattern is displayed known as a piercing line signifying the cfd market is piercing the bottom showing a market floor for the cfd price downward trend.
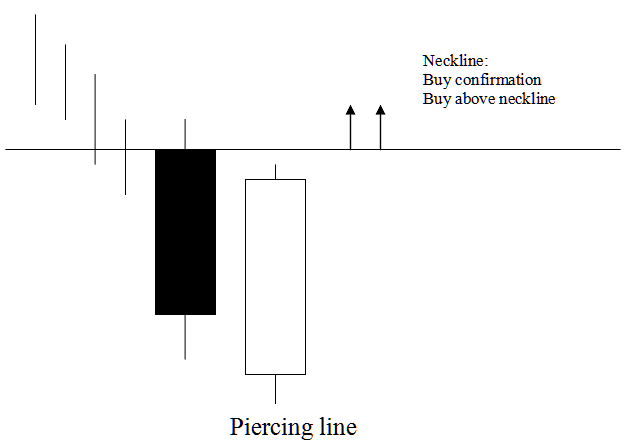
Piercing Line Candle
Technical Analysis Piercing Line Candle
A buy signal is confirmed once cfd price closes above neck line which is the opening of the candlestick on the left of the Piercing Line candlestick.
This is a bullish setup and cfd price should continue moving upwards and for a trader who puts a buy cfd trade should also place a stop loss order just below the lowest cfd price region.
Dark Cloud Cover Candlestick
Opposite of piercing candle.
This candle is a long white body followed by a long black body.
The black body pierces the mid point of the prior white body.
This is a bearish reversal cfd pattern which forms at the tops of an upwards cfds trend.
It shows that the cfd market opens higher & closes below the midpoint of the white body.
This shows that the momentum of the up cfd trend is reducing & the cfd market cfd trend is likely to reverse and move in a downwards direction.
This cfd pattern is shown known as a cloud cover signifying the cloud as a ceiling for the cfd price upwards trend.
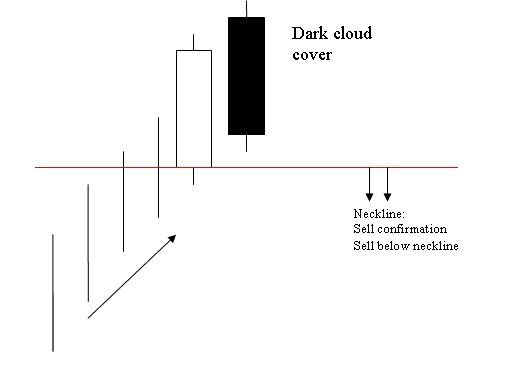
Dark Cloud Cover Candlestick
Technical Analysis Dark Cloud Cover Candle
A sell signal is confirmed once cfd price closes below neckline which is the opening of the candle on the left of this candlestick.
This is a bearish setup and cfd price should continue moving downwards and for a trader who puts a sell cfd trade should also put a stop-loss order just above the highest cfd price region.


